IB Geography • Section 1
Ocean–Atmosphere Interactions
How physical processes link Earth’s atmospheric and ocean systems
Restored from the original AdornGeo Weebly page • syllabus order preserved
Ocean Systems & Ocean Currents
The operation of ocean currents, including their distribution, nutrient and energy transfers and the importance of oceanic conveyor belts
Start by seeing the ocean as a connected system rather than a set of separate seas. Surface winds move warm water across ocean basins, while differences in temperature and salinity drive deep circulation. Together these transfers redistribute heat, oxygen and nutrients and help regulate climate far from the ocean itself.
- Surface currents are mainly driven by prevailing winds and deflected by the Coriolis effect.
- Warm currents transfer energy poleward; cold currents return cooler water towards lower latitudes.
- Upwelling brings cold, nutrient-rich deep water to the surface and supports highly productive marine ecosystems.
- Thermohaline circulation is driven by density differences caused by temperature and salinity and forms the global ocean conveyor belt.
- Use maps to connect major currents such as the Gulf Stream/North Atlantic Drift to regional climate patterns.

Watch: Met Office — differential heating and global circulation
El Niño & La Niña — ENSO
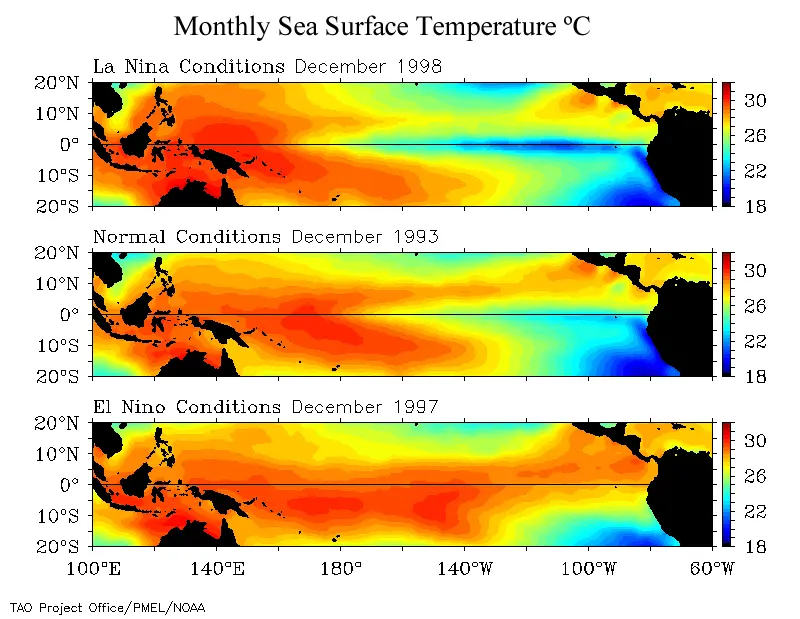
Atmosphere–oceanic interactions associated with El Niño–Southern Oscillation (ENSO) and La Niña cycles and their climatic, environmental and economic effects. Detailed examples of the geographic impacts of El Niño and La Niña.
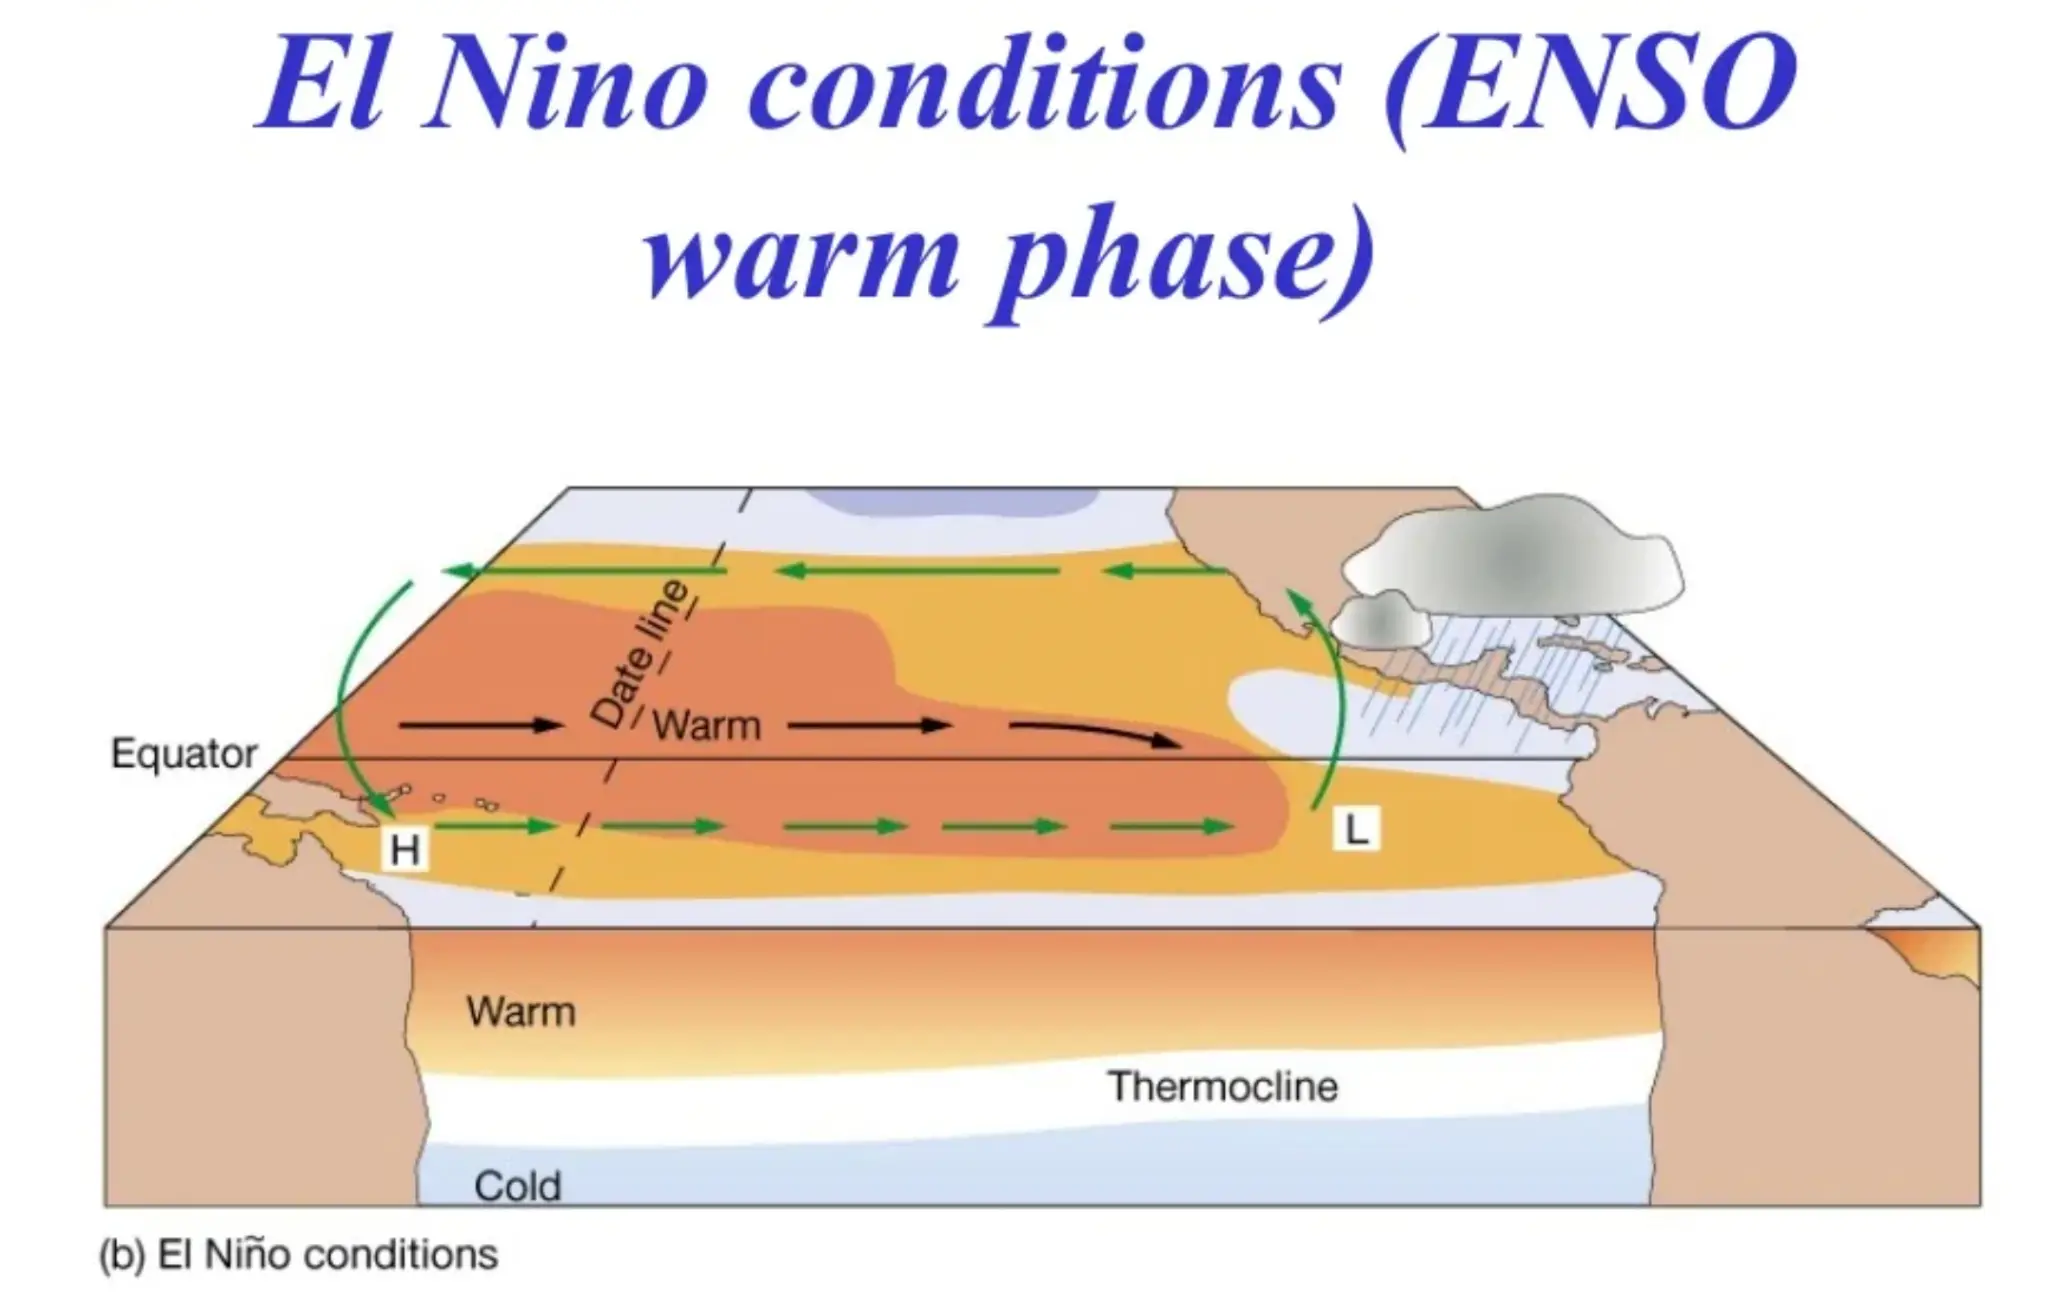
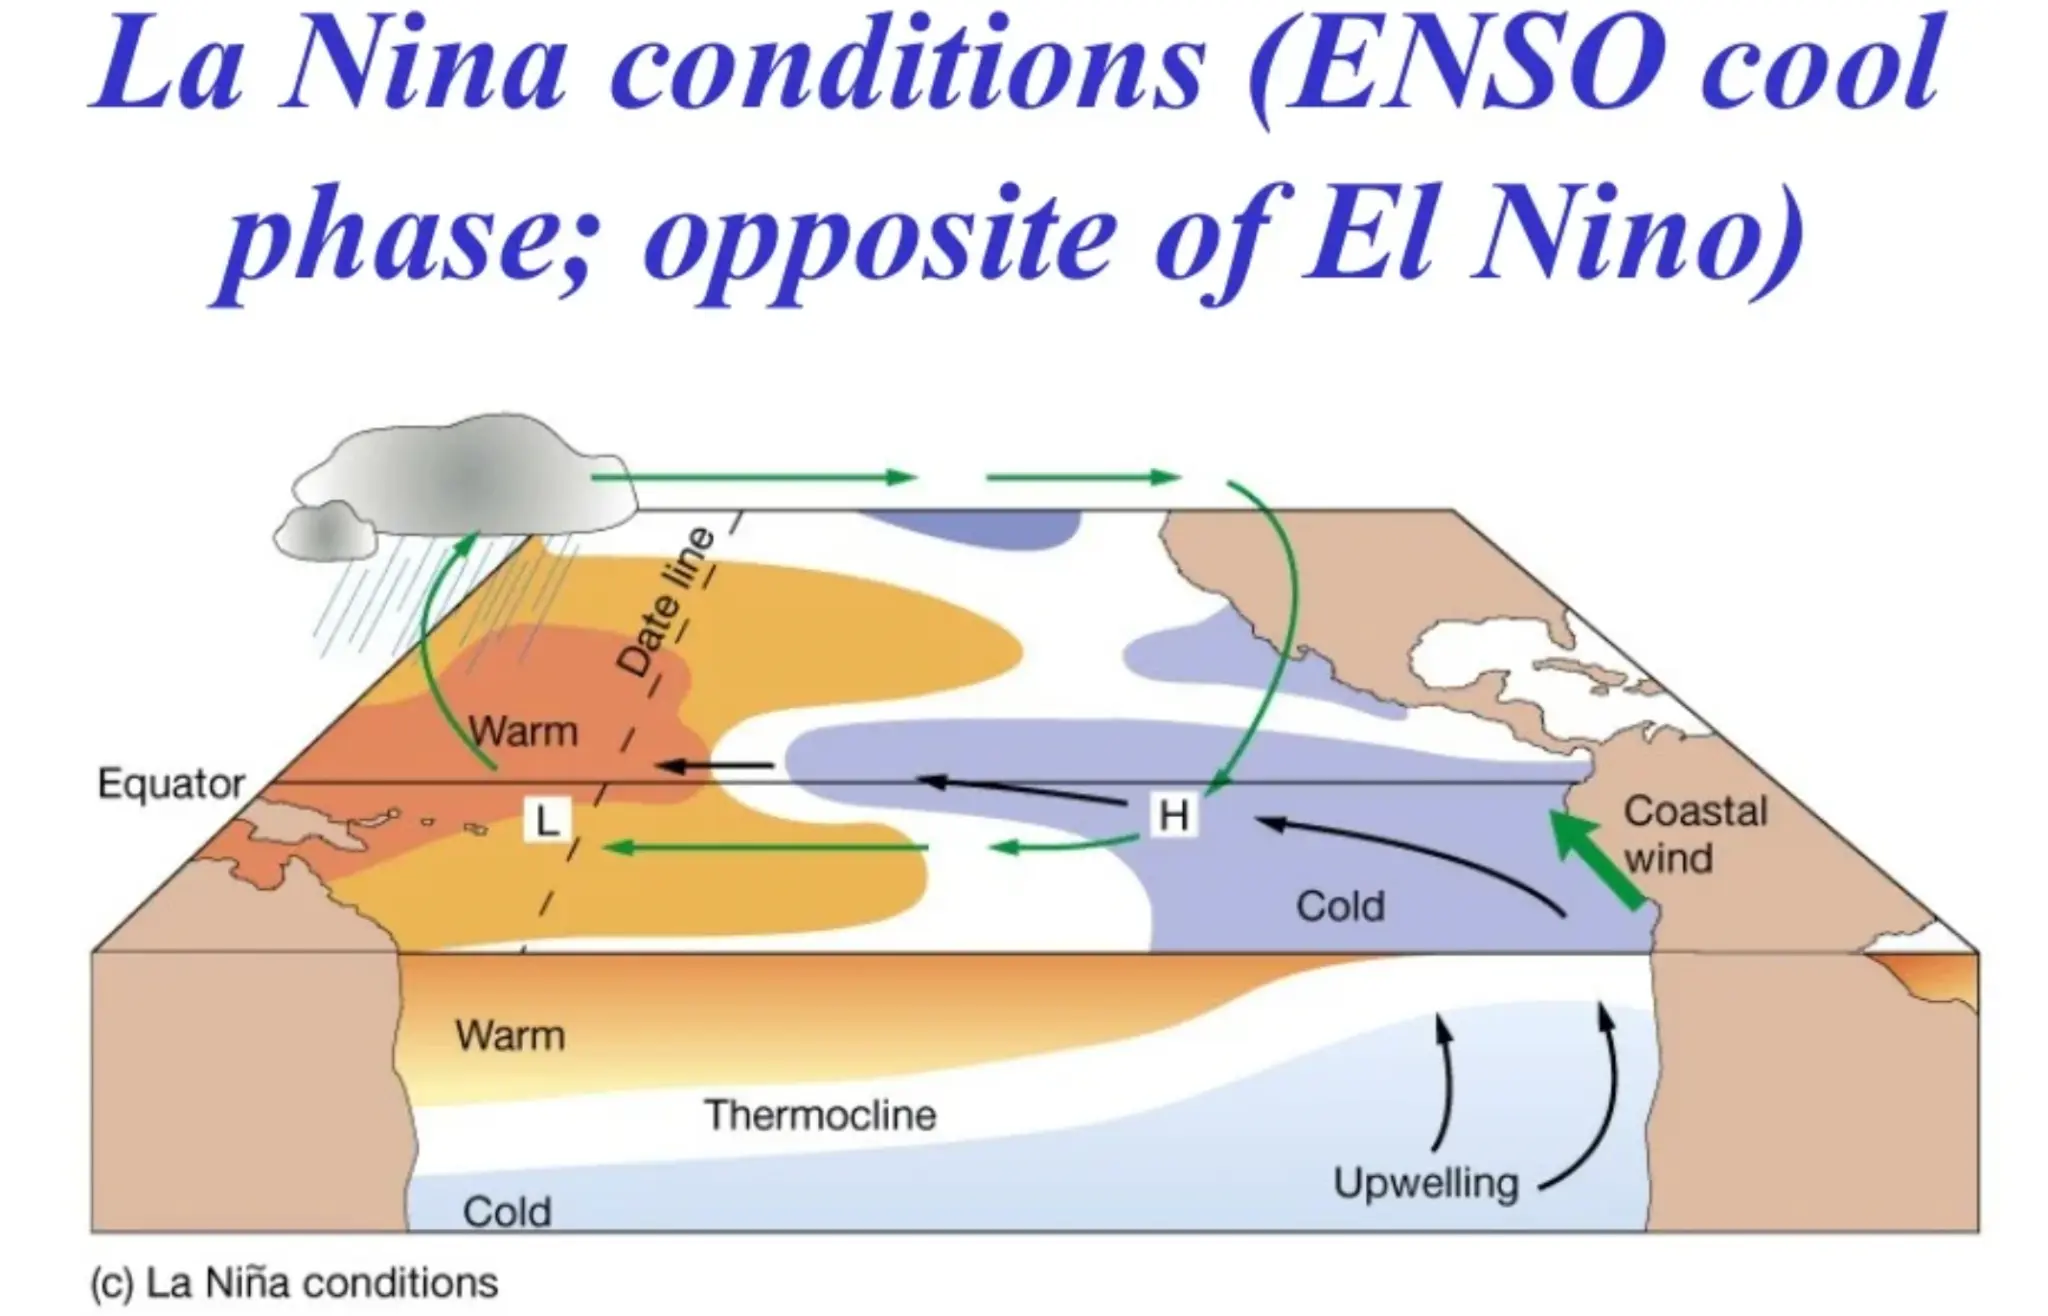
This is best learned as a three-stage comparison: normal Pacific conditions, El Niño and La Niña. Track the trade winds, movement of warm surface water, thermocline depth and upwelling first; then connect those physical changes to climatic, environmental and economic impacts in real places.
- Normal conditions: easterly trade winds pile warm surface water towards Indonesia and Australia; cold nutrient-rich water upwells off Peru and Ecuador.
- El Niño: trade winds weaken, warm water shifts east, the eastern thermocline deepens and upwelling/productivity decline.
- La Niña: trade winds strengthen and the normal east–west contrast is intensified.
- Impacts are geographically uneven: drought, flood, wildfire, fisheries disruption and agricultural losses can occur thousands of kilometres apart.
- Build case-study evidence by locating each impact on a map and classifying it as climatic, environmental and/or economic.
Watch: Met Office — El Niño: what is it?
Watch: El Niño and extreme-weather impacts
Hurricanes and Coastal Margins
The formation, distribution and physical impacts of hurricanes on coastal margins, including storm surge
Move from formation to hazard. Students should be able to explain why tropical cyclones form over particular warm oceans, why they do not form at the equator, how the system intensifies and why storm surge can be more destructive on a coast than wind alone.
- Warm ocean water (about 26.5°C or above), deep moisture, low vertical wind shear and atmospheric instability supply the energy for development.
- Coriolis force is needed for rotation, so tropical cyclones generally form away from the equator.
- Latent heat released by condensation powers falling pressure, stronger winds and further evaporation: a positive feedback.
- Storm surge is an abnormal rise in sea level driven by strong onshore winds and low pressure; coastal shape, bathymetry and tide can amplify it.
- Separate primary physical impacts from the social and economic consequences that follow them.
Watch: How hurricanes form — original lesson video
Case Study: Typhoon Haiyan
Case study of one hurricane and its impacts on coastal places and people
Use Haiyan (Yolanda), Philippines, 2013 to turn the physical-process work into a named case study. The strongest answers link the storm's path and intensity to storm surge, exposure and vulnerability, then distinguish immediate impacts from longer-term consequences and recovery.
- Locate the central Philippines and Tacloban, then trace Haiyan's path across the archipelago.
- Explain the storm surge rather than simply listing it as an impact.
- Organise specific evidence into social, economic, environmental and political impacts, and short- versus long-term effects.
- Use the case to consider why the same physical event creates very different outcomes for different groups and places.
Watch: Al Jazeera 101 East — Typhoon Haiyan: The Killer Storm
Watch: Al Jazeera 101 East — Philippines: After Haiyan
Quizlet: Typhoon Haiyan impacts — social, economic, environmental & political
Oceans, Carbon and Ocean Acidification
The changing role of oceans as a store and source of carbon dioxide (CO₂) and the impacts of ocean acidification on coral reefs
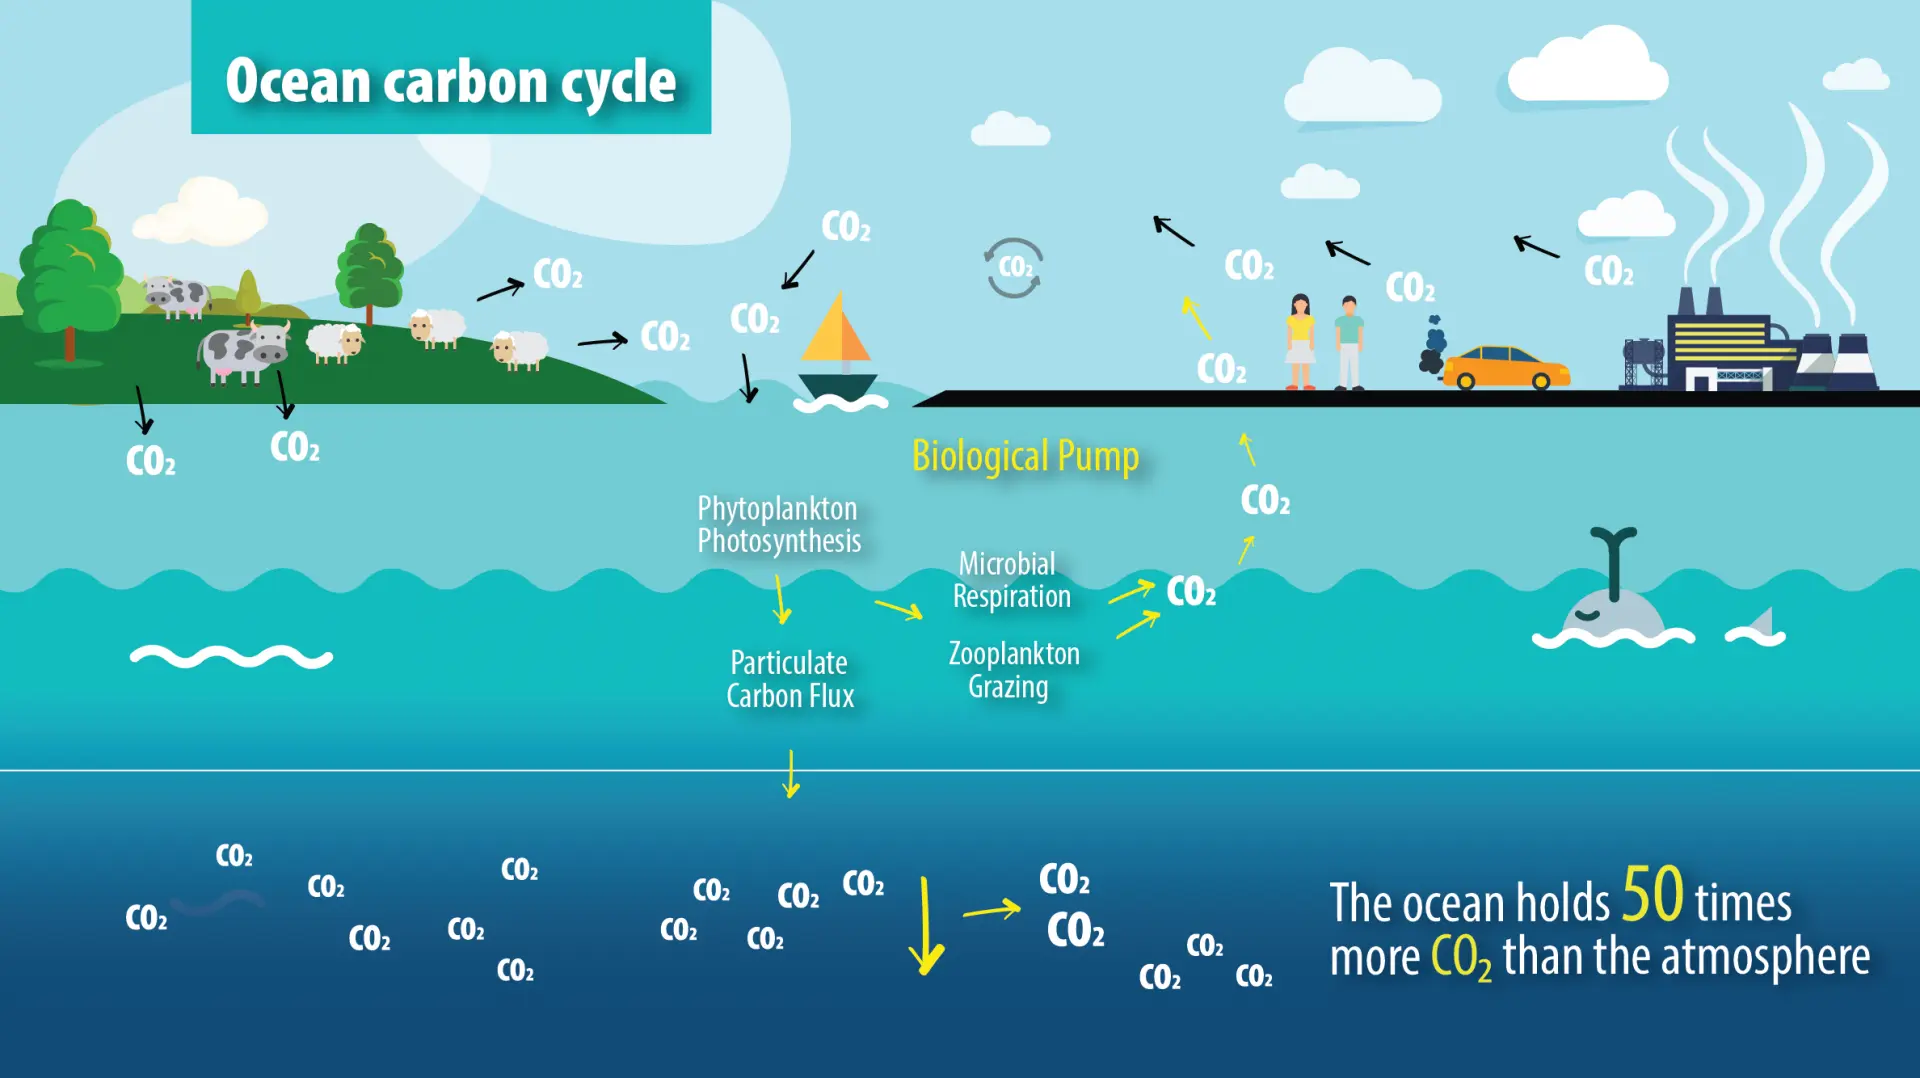
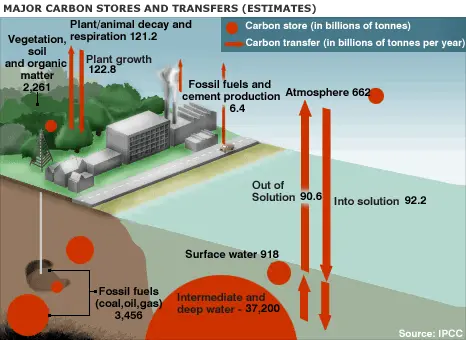
Finish the section by reconnecting atmosphere and ocean through the carbon cycle. The ocean absorbs a substantial share of anthropogenic CO₂, moderating atmospheric warming but changing seawater chemistry. That creates a clear systems story: a regulating service can also generate a serious ecological cost.
- CO₂ moves between atmosphere and ocean by diffusion; colder water can generally hold more dissolved CO₂.
- The solubility pump and biological pump help transfer carbon from surface waters into the deep ocean.
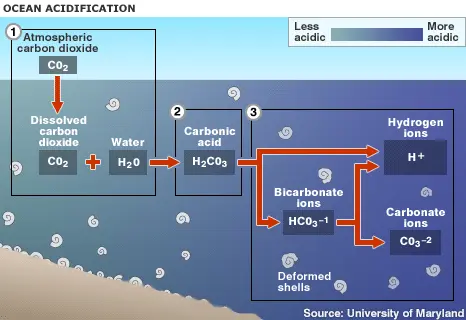
- Absorbed CO₂ reacts with seawater to form carbonic acid, lowering pH and reducing carbonate-ion availability.
- Corals and other calcifying organisms need carbonate to build calcium-carbonate structures, so acidification can weaken reef growth and resilience.
- Connect ocean warming and acidification: both are driven by rising atmospheric greenhouse gases but affect marine systems through different mechanisms.
Watch: What is Ocean Acidification?
Watch: Climate change: what is ocean acidification?
Watch: Ocean acidification — original slide-deck video
Watch: Oceans and carbon — original slide-deck video