IB Geography • Section 1
Global Trends in Consumption
How global development processes affect resource availability and consumption
Restored from the original AdornGeo Weebly page • syllabus order preserved
Progress towards Poverty Reduction
Global and regional/continental progress towards poverty reduction, including the growth of the new global middle class.
The original AdornGeo page starts with changing global development before moving into consumption. Students use evidence at different scales to establish the long-term fall in extreme poverty while recognising that progress is uneven between and within regions.
- Describe the global trend, then identify regional contrasts and exceptions rather than treating poverty reduction as uniform.
- Use absolute numbers as well as percentages: a falling poverty rate can coexist with large numbers of people remaining in poverty.
- Connect changing incomes to the later resource-consumption sections: development changes both needs and patterns of demand.
Rise of the New Global Middle Class
Global and regional/continental progress towards poverty reduction, including the growth of the new global middle class.
The second half of the original poverty section focuses on the rapid expansion of middle-income consumers. This is the bridge into the rest of the unit: rising incomes can improve wellbeing while also changing diets, energy demand, water use, travel and material consumption.
- Locate where the largest growth in the global middle class is taking place.
- Distinguish income classification of countries from the idea of a middle-class household or consumer.
- Ask how a larger consuming class changes pressure on food, water, land and energy systems.
Follow the consumption chain
- Choose one rising-income region and sketch a chain from higher disposable income to three changing forms of consumption.
- For each change, identify the resource demand created elsewhere: land, food, water, energy or minerals.
- Add one benefit for wellbeing and one possible cost for resource security. Finish by deciding which link in your chain is most important.
Quizlet: Global poverty reduction and the new global middle class
Measuring Trends in Resource Consumption
Measuring trends in resource consumption, including individual, national and global ecological footprints.
Ecological footprint is the core measuring tool used on the recovered page. The lesson moves from defining footprint and biocapacity to calculating a personal footprint and then comparing national patterns.
- Ecological footprint expresses human demand on biologically productive land and sea; biocapacity represents the capacity available to meet that demand.
- A footprint can be calculated at individual, national or global scale, so scale must be stated when interpreting the figure.
- Compare footprint per person with total national demand: population size and per-capita consumption tell different stories.
Footprint at three scales
- Read the ecological-footprint resource, then define footprint and biocapacity without copying the wording.
- Use the calculator for an individual result. Record the two lifestyle choices that have the greatest influence on it.
- Compare two contrasting countries in the data explorer. Explain why per-capita footprint and total national demand may produce different rankings.
- Evaluate the measure: identify one decision it can inform and one important environmental pressure it simplifies or omits.
Watch: Ecological footprint: do we fit on our planet?
Water Consumption & Virtual Water
Water, including embedded water in food and manufactured goods.
The recovered lesson treats water use as more than what comes from a tap. Students trace the hidden or virtual water embodied in food and manufactured goods, allowing consumption in one place to be connected to water demand somewhere else.
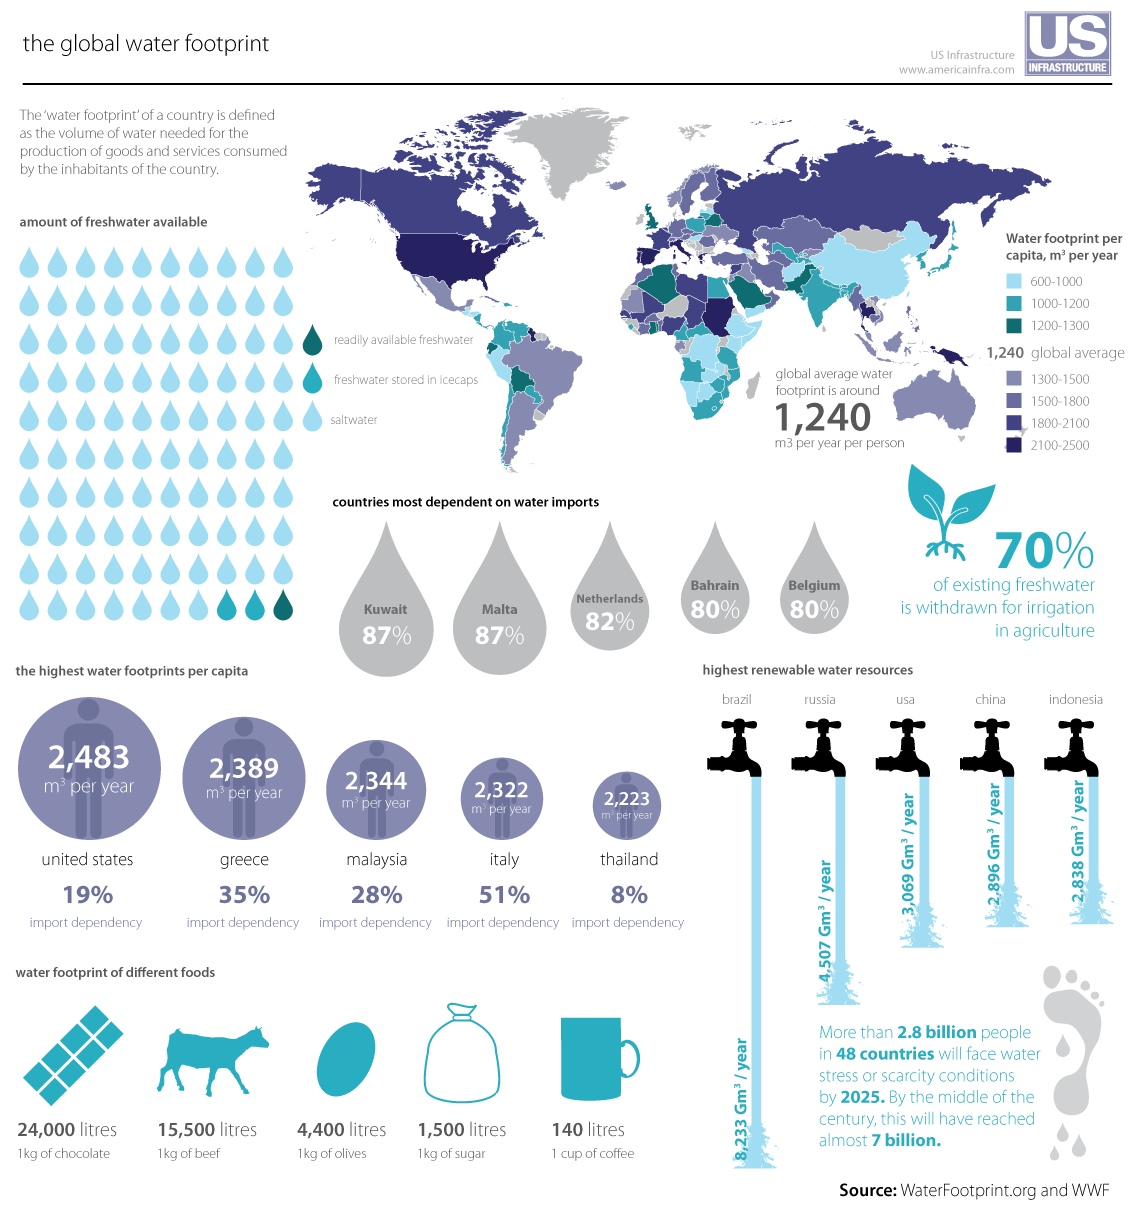
- Separate direct household water use from the much larger indirect water footprint of products and food.
- A product's water footprint links consumers to distant production regions through trade.
- Water demand should be interpreted alongside local water availability: the same footprint can have very different consequences in water-rich and water-stressed places.
Infographic analysis practice
- Study the water-footprint infographic and identify one country, excluding the USA, with a high footprint.
- State the main message in one precise sentence, then support it with two pieces of located evidence.
- Explain how trade in one water-intensive product can connect consumption in one country to water pressure in another.
- Evaluate the infographic out of six: consider clarity, data selection, scale, source, date and anything the design may conceal.
Land, Food & Changing Diets
Land/food, including changing diets in middle-income countries.
The original page links income change to the nutrition transition. Students compare what people eat, how diets shift as incomes rise, and why a move towards more resource-intensive foods changes pressure on land, water and energy.
- Describe dietary change using evidence before explaining it through income, urbanisation, food systems and cultural change.
- Different foods require different amounts of land, water, feed and energy, so diet is a geographical resource issue as well as a health issue.
- Use middle-income countries to test the idea of a nutrition transition rather than assuming every country follows the same pathway.
Cook up a food-stress explanation
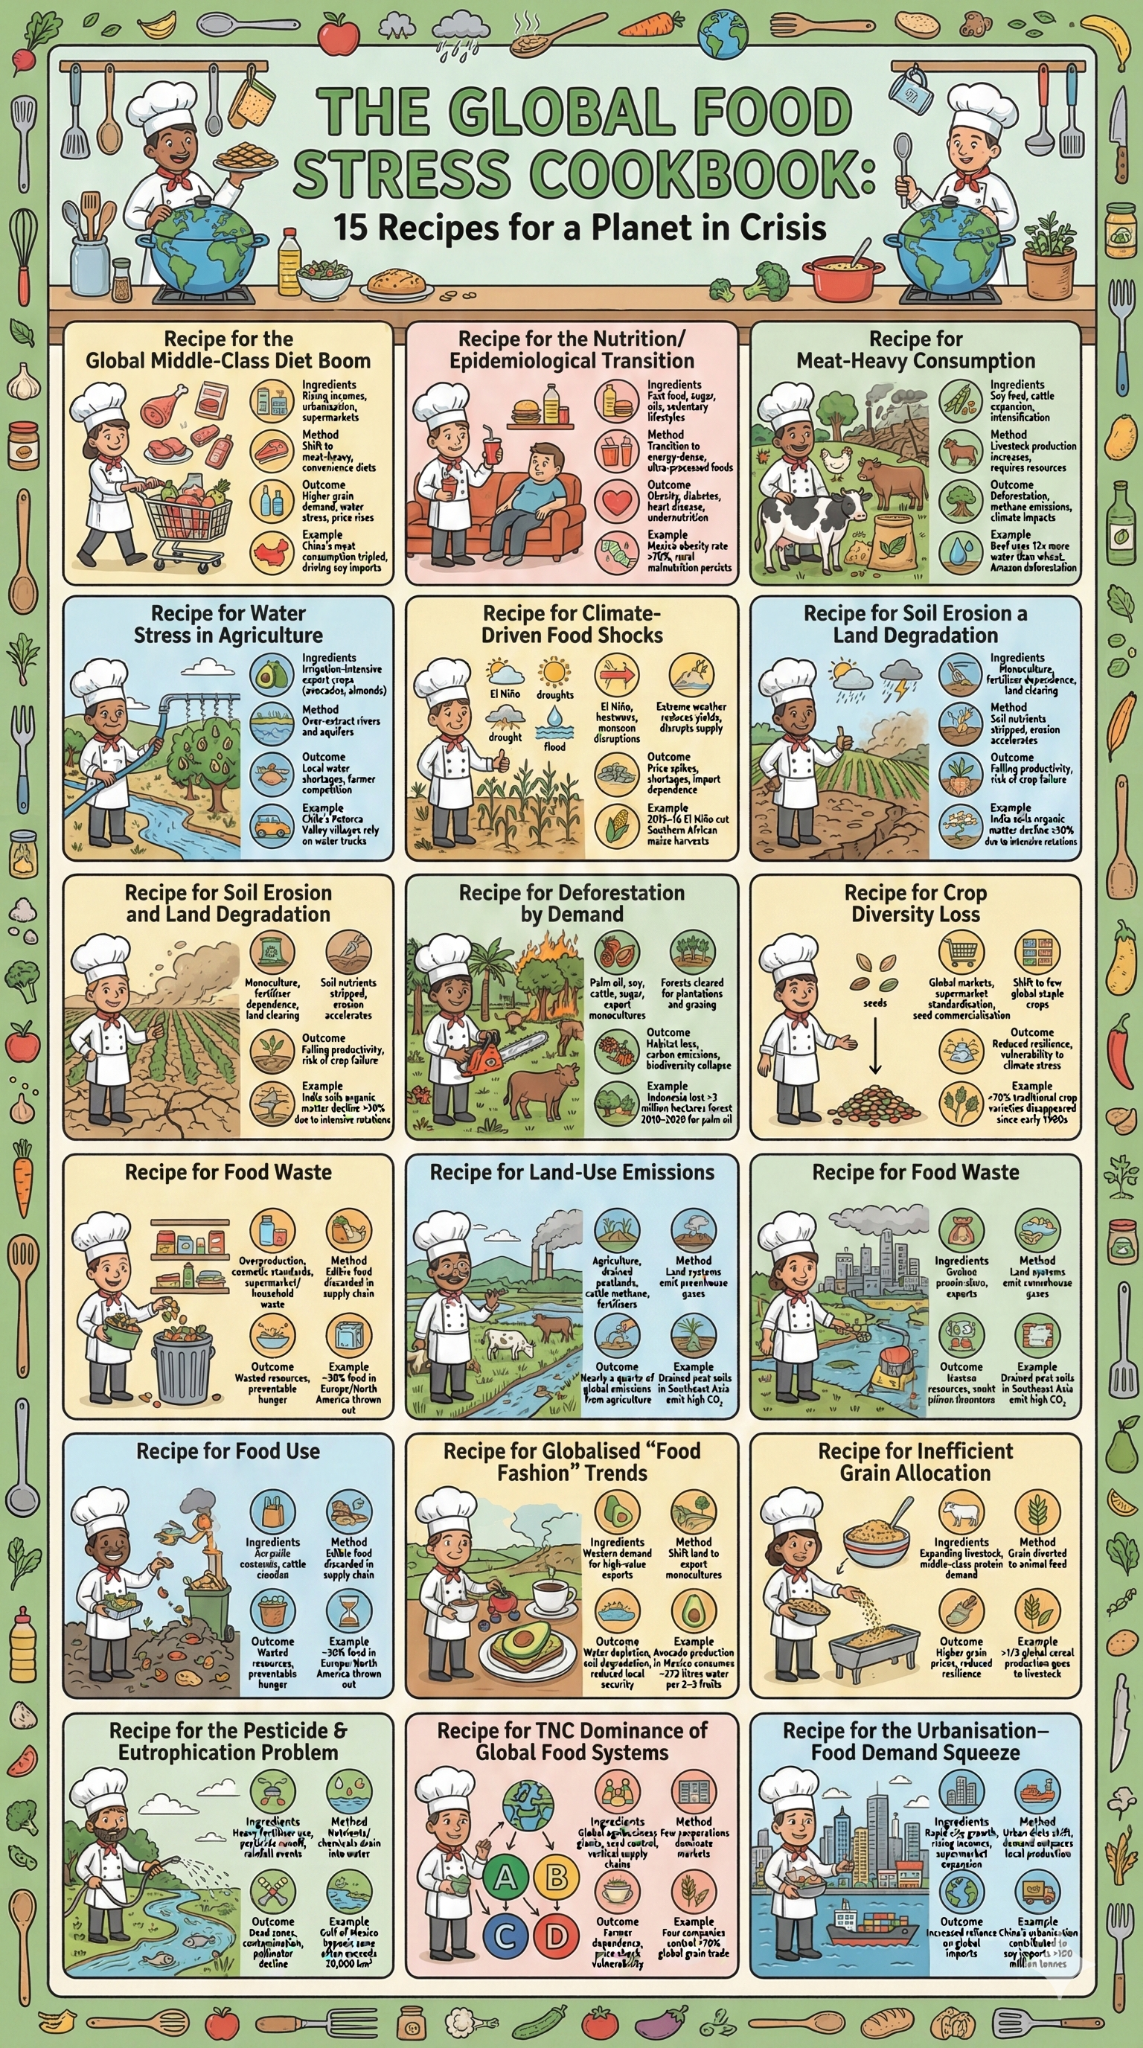
- Select three ‘recipes’ from the Global Food Stress Cookbook: one driven mainly by consumption, one by environmental change and one by the organisation of production.
- For each, rewrite the ingredients → method → outcome chain as a geographical systems diagram.
- Add a named place or commodity example and identify one connection between your three systems.
- Choose the most significant pressure and defend your judgment using evidence. Then identify two claims in the infographic that should be verified before using it in an essay.
Energy Consumption
Energy, including the relative and changing importance of hydrocarbons, nuclear power, renewables and new sources of modern energy.
The original lesson first establishes changing energy demand and the continuing importance of hydrocarbons, then asks students to compare the changing role of nuclear and renewable alternatives.
- Read the energy mix as a changing proportion as well as a change in total energy consumption.
- Compare fossil fuels, nuclear and renewables using availability, cost, reliability, environmental impact and energy security.
- Avoid equating electricity with total energy use: transport, heat and industry also shape the energy transition.
Read an energy mix geographically
- Watch The Great Shift and record evidence of continuity as well as transition: what remains dominant, what is growing, and what differs between places?
- Build a six-factor explanation for a country's energy mix using physical, technological, environmental, economic, social and political influences.
- Explain why a country can expand renewables rapidly while its total fossil-fuel use remains high.
- Write a two-sentence conclusion judging whether the global energy system is experiencing replacement, diversification or both.
Watch: Global Energy — The Great Shift
Changing Importance of Non-Hydrocarbon Energy Sources
Energy, including the relative and changing importance of hydrocarbons, nuclear power, renewables and new sources of modern energy.
This was a distinct teaching section on the old page. Students use the energy-mix evidence to examine how and why alternatives to fossil fuels become more or less important in different places.
- Examine means more than describe: explain the drivers of change and weigh their relative importance.
- A useful comparison considers three alternatives and anchors claims in named places and energy-mix evidence.
- Government policy, technology, price, resource endowment, public attitudes and energy security can push transitions in different directions.
Interrogate the great energy transition
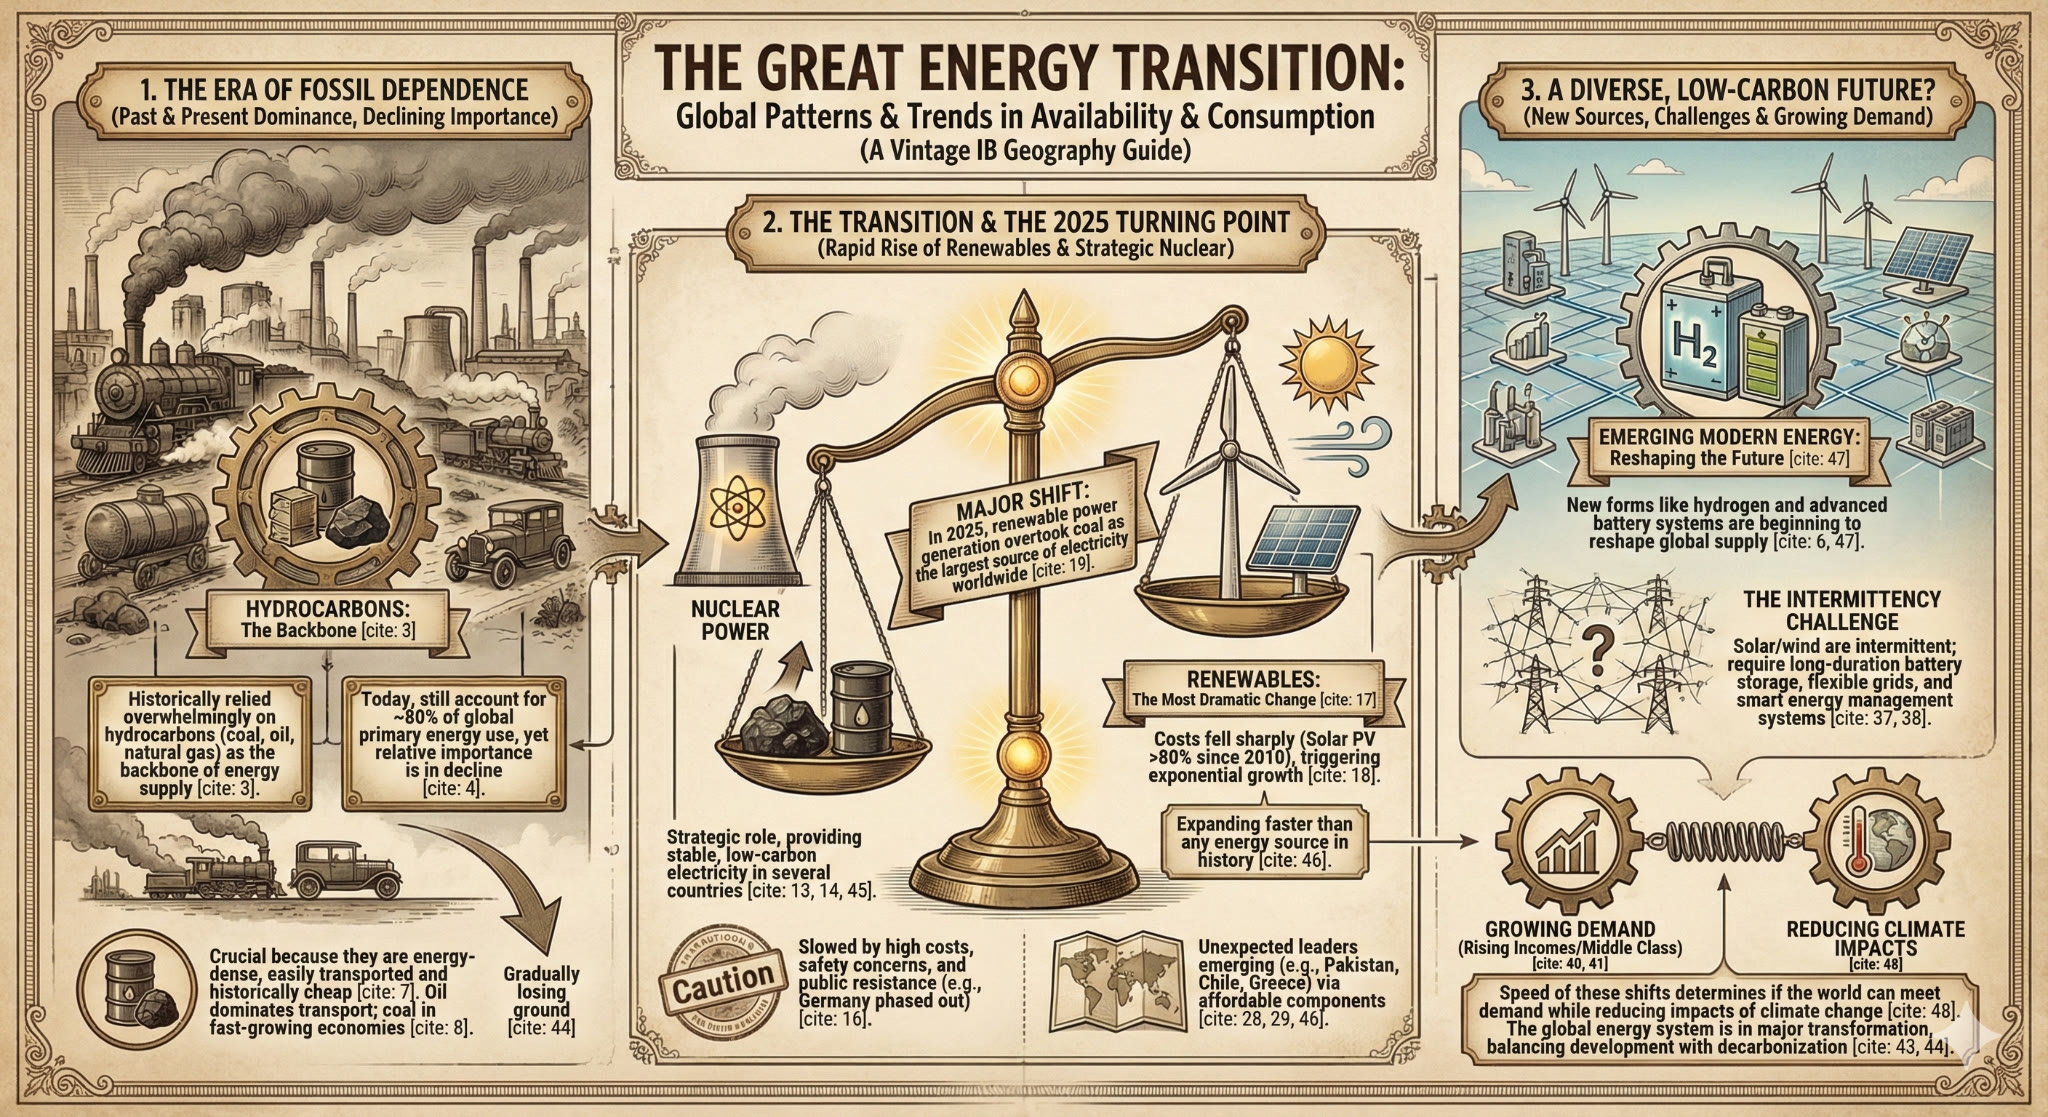
- Annotate the infographic with C for continuity, T for transition and U for uncertainty.
- Compare hydrocarbons, nuclear and renewables using reliability, cost, carbon impact, build time and energy-security implications.
- Explain the intermittency challenge and assess how storage, flexible grids and demand management respond to it.
- Check two quantitative claims against the current IEA or Energy Institute data. Update the claims if necessary and record the source year.
Watch: Renewable energy in Europe — legacy lesson video