IB Geography • Section 2
Geophysical Hazard Risks
How geophysical systems generate hazard risks for different places
Restored from the original AdornGeo Weebly page • syllabus order preserved
Distribution of Geophysical Hazards
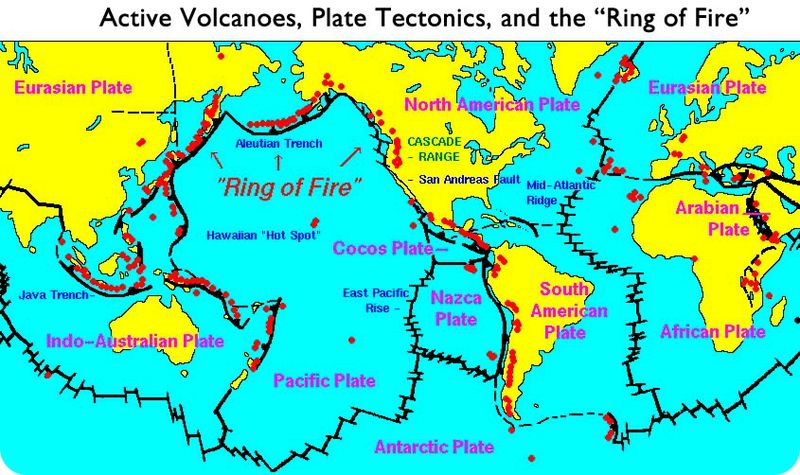
The distribution of geophysical hazards (earthquakes, volcanoes, mass movements).
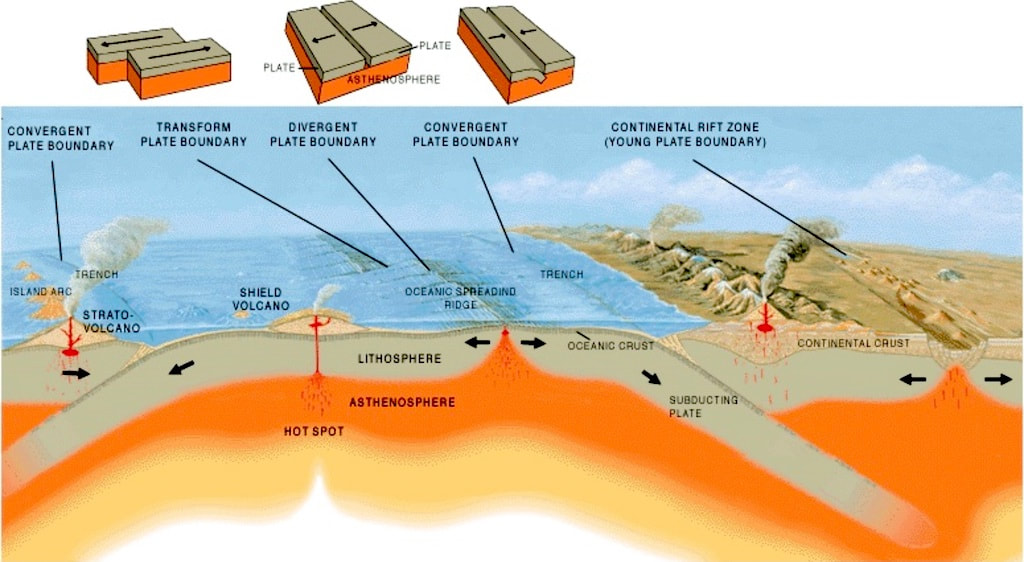
Start with pattern before explanation. Earthquakes and volcanoes concentrate around active plate margins, while hot spots create important volcanic exceptions. Mass movements have a wider distribution because relief, geology, water, seismic shaking and human modification all influence slope stability.
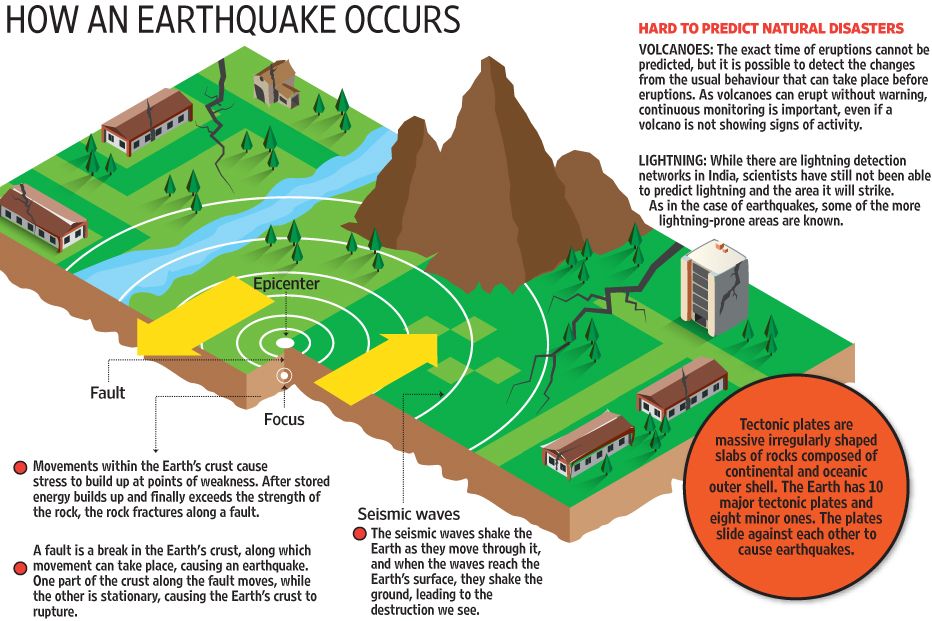
- Earthquakes occur at all plate-margin types, with a major concentration around the Pacific Ring of Fire and the Alpine–Himalayan belt.
- Most volcanoes occur at constructive and destructive margins; hot spots explain intraplate chains such as Hawaii.
- Mass movements cluster in steep highland, tectonically active and coastal environments, but rainfall and human disturbance can create risk far from plate margins.
- A hazard map shows where events may occur; it does not by itself show exposure, vulnerability or disaster risk.
Enquiry 1 — From pattern to process
- Read the new Distribution of Geophysical Hazards briefing, then highlight one claim about earthquakes, volcanoes and landslides that the live maps can test.
- Open the original A3 map and use the live earthquake, volcano and landslide sources to add three different symbols or layers.
- Annotate the Pacific Ring of Fire, the Mid-Atlantic Ridge, the Alpine–Himalayan belt and two intraplate hot spots.
- Write one PEEL paragraph for each hazard explaining its main distribution, physical cause and at least one exception.
- Add a final warning explaining why event distribution cannot be treated as a complete map of risk.
Watch: Types and distribution of geophysical hazards
Watch: Plate tectonics and the global hazard pattern
Hazard Magnitude, Frequency & Recurrence
The relevance of hazard magnitude and frequency/recurrence for risk management.
Risk managers need more than a record of the largest event. Magnitude describes event size, frequency describes how often events occur, and recurrence or return interval estimates the long-term likelihood of a similar event. These measures are uncertain and must be read together.
- Earthquake magnitude is commonly reported using the Moment Magnitude Scale; each whole-number rise represents ten times greater recorded amplitude and roughly 32 times more energy release.
- The Modified Mercalli scale describes observed intensity and therefore varies from place to place during the same earthquake.
- Volcanic explosivity can be compared using the VEI, while mass movements need a profile that includes volume, speed, duration and spatial extent.
- Frequent low-magnitude events may support awareness and building standards; rare high-magnitude events are harder to remember, finance and plan for.
- A recurrence interval is a probability based on an incomplete record, not a prediction that an event will happen on schedule.
Enquiry 2 — Has the world become safer?
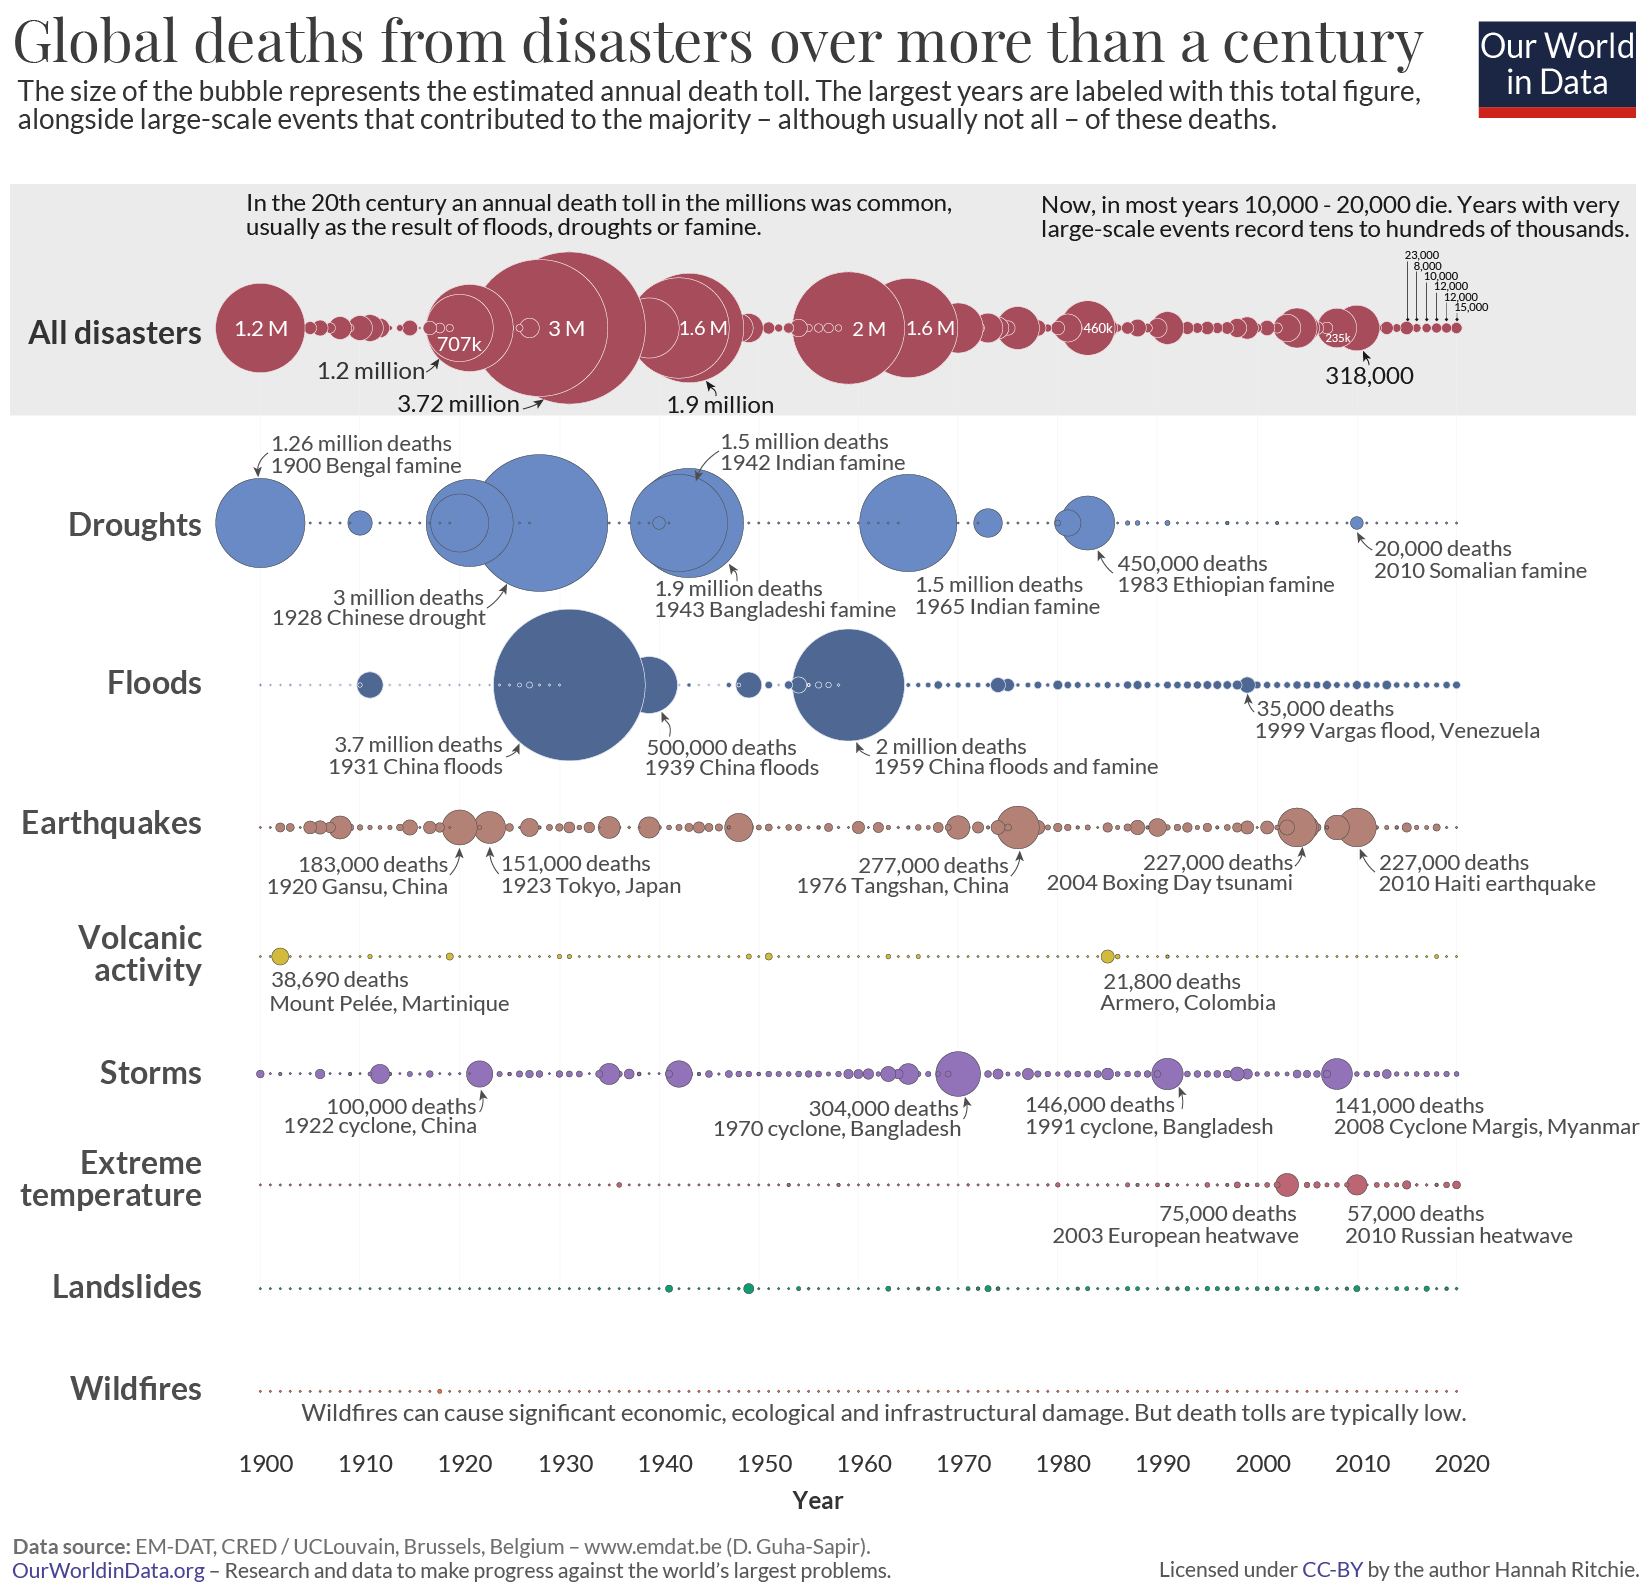
- Study the century of disaster deaths. Describe the overall change in annual mortality, then identify two major exceptions to the trend.
- Compare earthquake and volcanic deaths. Suggest why earthquake bubbles remain more prominent even though both hazards are concentrated near plate margins.
- Challenge the graphic: explain why deaths alone cannot show the full severity of a disaster or prove that hazard frequency has fallen.
- Create a hazard-profile radar diagram using magnitude, frequency, speed of onset, duration, areal extent and predictability.
- Compare a high-frequency, lower-magnitude event with a rare, high-magnitude event and identify the different planning needs.
- Answer the IB-style prompt: Explain how frequency of past events and magnitude of past events can each help a community manage risk.
Watch: Moment magnitude explained
Watch: Richter scale and modern earthquake measurement
Watch: Comparing earthquake energy release
Human Risk Factors
Geophysical hazard risk as a product of economic factors (levels of development and technology), social factors (education, gender), demographic factors (population density and structure) and political factors (governance).
A physical event becomes a disaster through exposure and vulnerability. Use the risk relationship as an organising device rather than a fixed calculation: risk rises when hazard and exposure are high, and falls when vulnerability is reduced and coping capacity grows.
- Economic development can reduce mortality through safer buildings, monitoring, insurance and emergency capacity, while also increasing the value of exposed assets.
- Education, risk perception, language, gender roles and access to warnings influence who receives information and who can act on it.
- Dense populations and dependent age structures can increase exposure and complicate evacuation, although density can also improve access to services.
- Governance shapes building-code enforcement, land-use planning, public trust, corruption, emergency coordination and the fair distribution of aid.
- Vulnerability varies within every country and city; national income alone never explains the complete pattern.
Enquiry 3 — Vulnerability ranking challenge
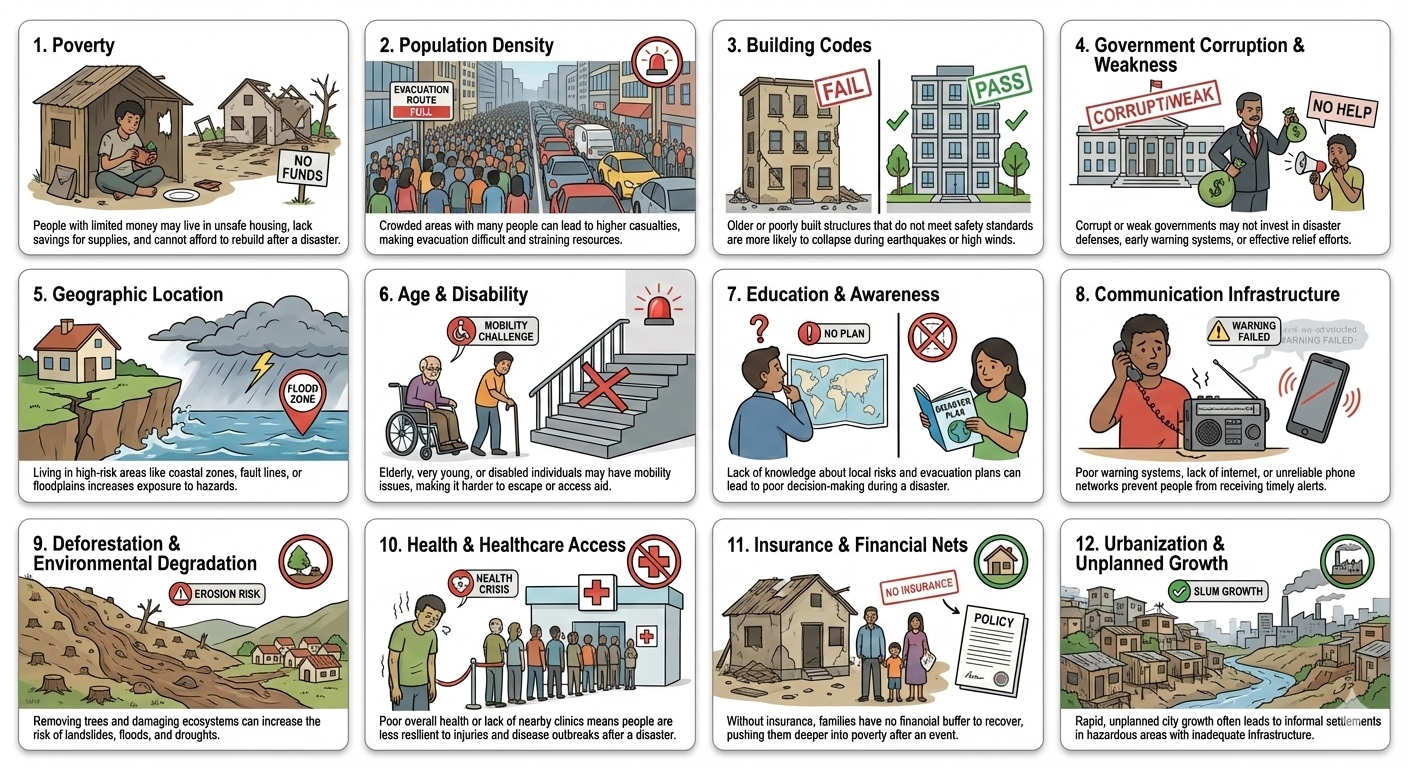
- Working in pairs, cut up or digitally inspect the 12 vulnerability factors. Sort them into economic, social, demographic, political and environmental groups; allow justified overlaps.
- Rank the factors for an earthquake-prone megacity, then repeat for an isolated volcanic community. Record which rankings change and why.
- Add one missing factor and challenge one card whose wording is too simple. For example, density can increase exposure but may also improve access to services.
- Choose one earthquake-prone city and identify its hazard, exposed people and assets, vulnerabilities and capacities.
- Sort your evidence into economic, social, demographic and political factors; show interactions with arrows.
- Redesign one factor as a practical risk-reduction intervention, naming the stakeholder with the power to act.
Watch: UNDRR: the three components of disaster risk
Watch: UNDRR: mapping vulnerability to disasters
Watch: Vulnerability, disasters and older people
Quizlet: IB Geography Option D — Geophysical Hazards
Geographic Factors Affecting Event Impacts
Geographic factors affecting geophysical hazard event impacts, including rural/urban location, time of day and degree of isolation.
The same magnitude does not produce the same impact everywhere. Settlement form, daily rhythms and connectivity change exposure, rescue access and the speed at which secondary impacts spread through infrastructure and supply networks.
- Urban events may expose dense populations, high-rise buildings and interdependent infrastructure; rural events may affect fewer people but leave dispersed communities harder to reach.
- Time of day changes occupancy: homes, schools, workplaces, roads and public transport contain different populations at different times.
- Isolation can delay warning, search and rescue, medical care, relief and reconstruction; damaged bridges, ports and communications can create new isolation after an event.
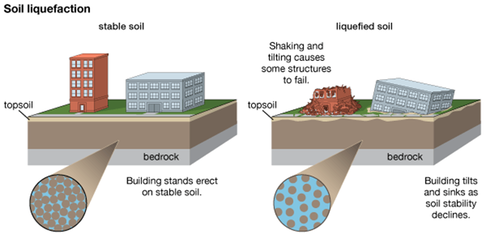
- Physical geography interacts with these factors: steep relief, unstable sediment, coastlines and weather conditions may intensify secondary hazards and constrain access.
- Impacts should be assessed through human well-being as well as deaths and financial loss, including health, shelter, education, livelihoods, security and social connection.
Enquiry 4 — Same hazard, different place
- Read Geographic Factors Affecting the Impacts of Geophysical Events and build a cause–effect table for Christchurch, Nepal, Mexico City, Tōhoku, Pinatubo and Volcán de Fuego.
- Apply the same earthquake scenario to a dense city centre, a peri-urban settlement and an isolated mountain community.
- Repeat the scenario for daytime and night-time, identifying who is exposed and which services are operating.
- Draw an impact cascade from ground shaking to transport, power, water, communications, health care and livelihoods.
- Write a reasoned judgement: Which geographic factor matters most? Use two contrasting named places and explain when your judgement would change.
Watch: Earthquakes and social factors — IB Geography
Watch: UNDRR: four pillars of an early-warning system