IB Geography • Section 2
Tourism and Sport at the Local and National Scale
How physical and human factors shape places into sites of leisure
Restored from the original AdornGeo Weebly page • syllabus order preserved
Growth of Rural and Urban Tourism Hotspots
Human and physical factors explaining the growth of rural and urban tourism hotspots, including the role of primary and secondary touristic resources.
The original AdornGeo lesson begins by defining tourist attractions, hotspots and honeypots, then uses Thailand to show how primary resources and purpose-built secondary resources combine with accessibility, safety and promotion. Students distinguish seasonal hotspots from diurnal hotspots and map Bangkok, Phuket, Pattaya and Chiang Mai before applying the same framework to one urban and one rural destination.
- Primary touristic resources already exist at the destination: beaches, climate, scenery, wildlife, heritage, culture and historic buildings.
- Secondary resources are developed for visitors: accommodation, restaurants, airports, roads, attractions, tours and entertainment.
- A hotspot receives high visitor numbers; a smaller concentrated hotspot may be described as a honeypot.
- Visitor pressure may be seasonal, with peaks at particular times of year, or diurnal, with peaks at particular times of day.
- Accessibility, security, marketing, affordability and digital visibility can turn an attractive place into a major tourism hotspot.
What spots are hotspots?
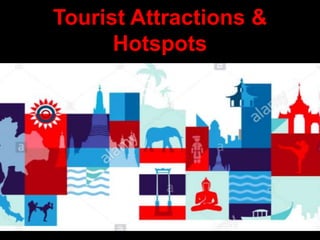
- Study the original Tourist Attractions & Hotspots presentation below. Make a two-column glossary of primary and secondary resources and add three located examples to each.
- On a blank map of Thailand, locate Bangkok, Phuket, Pattaya and Chiang Mai. Annotate the main human and physical resources that help explain each hotspot.
- Classify six destinations as rural or urban, then identify which are likely to experience seasonal or diurnal peaks.
- Use the three Venice clips as a comparison: identify why Venice is a hotspot and explain two ways its popularity creates pressure on place.
IB comparison
- Choose one urban hotspot and one rural hotspot. Build a factor table covering site, situation, accessibility, primary resources, secondary resources, image and security.
- Write a supported conclusion answering: To what extent are human factors more important than physical factors in explaining the growth of tourism hotspots?
Watch: Venice as an urban tourism hotspot
Watch: Tourism pressure in Venice: cruise-ship collision
Watch: Venice, visitors and the changing city
Variations in Sphere of Influence
Variations in sphere of influence for different kinds of sporting and touristic facility, including neighbourhood parks and gyms, city stadiums and national parks.
The original eight-slide AdornGeo presentation links leisure provision to settlement hierarchy. Small, frequently used facilities have a low threshold, short range and local sphere of influence; rarer, larger and more expensive facilities need a bigger threshold population and draw users over a wider range.
- A sphere of influence is the area from which a facility attracts its users or visitors.
- Threshold is the minimum population or demand needed to support a facility; range is the maximum distance people are prepared to travel to use it.
- Neighbourhood parks and gyms are lower-order facilities, while major stadiums and internationally known national parks are higher-order facilities.
- Accessibility, income, capacity, quality, rarity, frequency of use and cultural importance alter a facility's sphere of influence.
- Digital broadcasting can give a sporting facility a global cultural sphere even when most spectators never visit it.
Construct a leisure hierarchy
- Place a playground, local gym, district swimming pool, city stadium and national park into a hierarchy. For each, estimate threshold, range and frequency of use.
- Draw nested spheres of influence for the five facilities and annotate two reasons why the circles would not be perfectly regular in the real world.
- Apply the model to your own locality: map five leisure facilities, rank them and identify which groups may be excluded by price, distance or transport.
- Explain how economic development, accessibility, history, culture, climate and a major event could change the hierarchy over time.

Geography of a National Sports League
Factors affecting the geography of a national sports league, including the location and hierarchy of its teams and the distribution of supporters. Case study of one national sports league.
This lesson treats a sports league as a spatial system. The English Premier League provides a clear located example: its club distribution still reflects nineteenth-century industrial cities, docks and working-class communities, while finance, promotion and relegation create a changing hierarchy. Broadcasting, migration and club brands have expanded many supporter catchments far beyond England.
- Club location reflects urban population, industrial history, local identity, transport, stadium provision and investment.
- A league hierarchy can be measured through division, revenue, wages, attendance, trophies, stadium capacity and media exposure.
- Promotion and relegation alter the map each season, but London and the industrial North-West remain important clusters.
- Supporters may be local, regional, national or international; media and merchandising allow a club's sphere of influence to exceed its match-day catchment.
- Successful clubs often have the widest supporter distributions, but local rivalries and inherited family loyalties remain geographically important.
Map the Premier League
- Map the current clubs and identify clusters, gaps and outliers. Add major cities, population density and the historic industrial regions.
- Create a hierarchy using three indicators: recent league position, stadium capacity and revenue. Explain where the hierarchies disagree.
- Compare match-day supporters with the wider national and global fan base of one club. Identify the processes that created that wider sphere.
- Evaluate the statement: the geography of the Premier League is explained more by history than by present-day population.
Watch: How the geography of a national football league can be investigated
English Premier League — England, UK
Twenty clubs form the top tier of English football. London and the North-West contain major clusters, reflecting both the capital's population and the industrial origins of professional football. A financial 'Big Six' has dominated revenue and media reach, while promotion and relegation keep the lower part of the hierarchy dynamic.
- Link club locations to Victorian industrial geography, ports, factories and urban population.
- Distinguish the local match-day catchment from national and global supporter distributions.
- Explain how television rights, shirt sales, overseas tours and social media extend spheres of influence.
- Use located examples from London, Manchester, Liverpool and one smaller-market club.
Large-scale Festivals as Temporary Sites of Leisure
Large-scale sporting, musical, cultural or religious festivals as temporary sites of leisure and their associated costs and benefits. Case study of one festival in a rural location, its site factors and geographic impacts.
The original AdornGeo case study follows the Full Moon Party at Hat Rin on Ko Pha-ngan. A rural beach settlement becomes a temporary international leisure site every month. Its island location, beach, warm climate and backpacker image attract visitors, while ferries, accommodation, bars and social media allow the event to operate at a much larger scale than the resident settlement.
- Festivals temporarily change flows of people, money, waste, traffic and risk within a place.
- Hat Rin's beach, climate and island setting are primary resources; ferries, hostels, bars, roads and emergency services are secondary resources.
- Economic benefits include income, employment, extended stays and demand for local transport and accommodation.
- Social and environmental costs include noise, crowding, litter, sewage pressure, injuries, crime, fire risk and conflict with residents.
- Costs and benefits are uneven: business owners may gain directly while residents and ecosystems experience diffuse costs.
Full Moon Party enquiry
- Use the map to describe Hat Rin's site and situation. Consider relief, beach form, access, space, nearby settlements and possible conflict.
- Complete the original case-study document and classify the impacts as economic, social or environmental; positive or negative; short- or long-term.
- Use the original role cards to hold a meeting between residents, business owners, tourists, police, ferry operators and environmental groups.
- Design three realistic management strategies and evaluate each using effectiveness, cost, fairness and enforceability.
- Answer: Examine the geographic impacts of one festival on the surrounding rural area. [10]
Watch: Experiencing the Full Moon Party landscape on Ko Pha-ngan
Full Moon Party — Hat Rin, Ko Pha-ngan, Thailand
Beginning as a small backpacker gathering in the 1980s, the monthly beach party grew into an internationally known event attracting thousands of visitors. The case study is especially useful because the same isolation that creates its island appeal also constrains transport, waste management, policing and emergency access.
- Located at Hat Rin on the southern tip of Ko Pha-ngan in Surat Thani Province.
- Explain growth through word of mouth, backpacker routes, social media and the expansion of ferry and accommodation capacity.
- Separate concentrated business benefits from more widely distributed social and environmental costs.
- Evaluate the glass restrictions, security, medical provision, ferry scheduling and waste-management responses.