IB Geography • Section 2.1
Causes of Global Climate Change
How natural and human processes affect the global energy balance
Restored from the original AdornGeo Weebly page • syllabus order preserved
The Atmospheric System
The atmospheric system, including the natural greenhouse effect and energy balance (incoming shortwave radiation and outgoing longwave radiation).
Begin with the atmosphere as a connected system. Students move from its layered structure to the transfer of solar energy, then distinguish the life-supporting natural greenhouse effect from later human enhancement.
- Incoming solar energy is mainly shortwave radiation; Earth returns energy to space mainly as longwave radiation.
- Some radiation is reflected by clouds, aerosols and bright surfaces, while the rest is absorbed by the atmosphere, land and oceans.
- Greenhouse gases absorb and re-radiate outgoing longwave radiation. The natural greenhouse effect keeps Earth warm enough for life.
- Energy balance is dynamic: a change in one store or flow can affect the whole atmospheric system.
Tipping the balance: build the atmospheric energy story
- Watch the two new opening videos and identify the system inputs, stores, transfers and outputs that control Earth's climate.
- Pause the atmospheric-system video and sketch the system. Add arrows for incoming shortwave radiation, reflection, absorption and outgoing longwave radiation.
- Use the longer Tipping the Balance introduction to add human drivers, feedbacks and possible thresholds to the same diagram.
- Complete the original Layers of the Atmosphere activity and the fill-in-the-blanks exercise.
- Write a 100-word explanation of why the natural greenhouse effect is essential rather than inherently harmful.

Watch: Earth's atmospheric system and energy balance
Watch: Tipping the Balance — causes, connections and climate-system change
Watch: Nature Is Speaking: Sky
Watch: Journey to the Stratosphere
Watch: Introduction to Atmospheric Physics
Watch: Global Average Energy Budget of the Atmosphere
Watch: NASA: The Greenhouse Effect
Watch: The Earth's Energy Balance
Changes in the Global Energy Balance
Changes in the global energy balance, and the role of feedback loops.
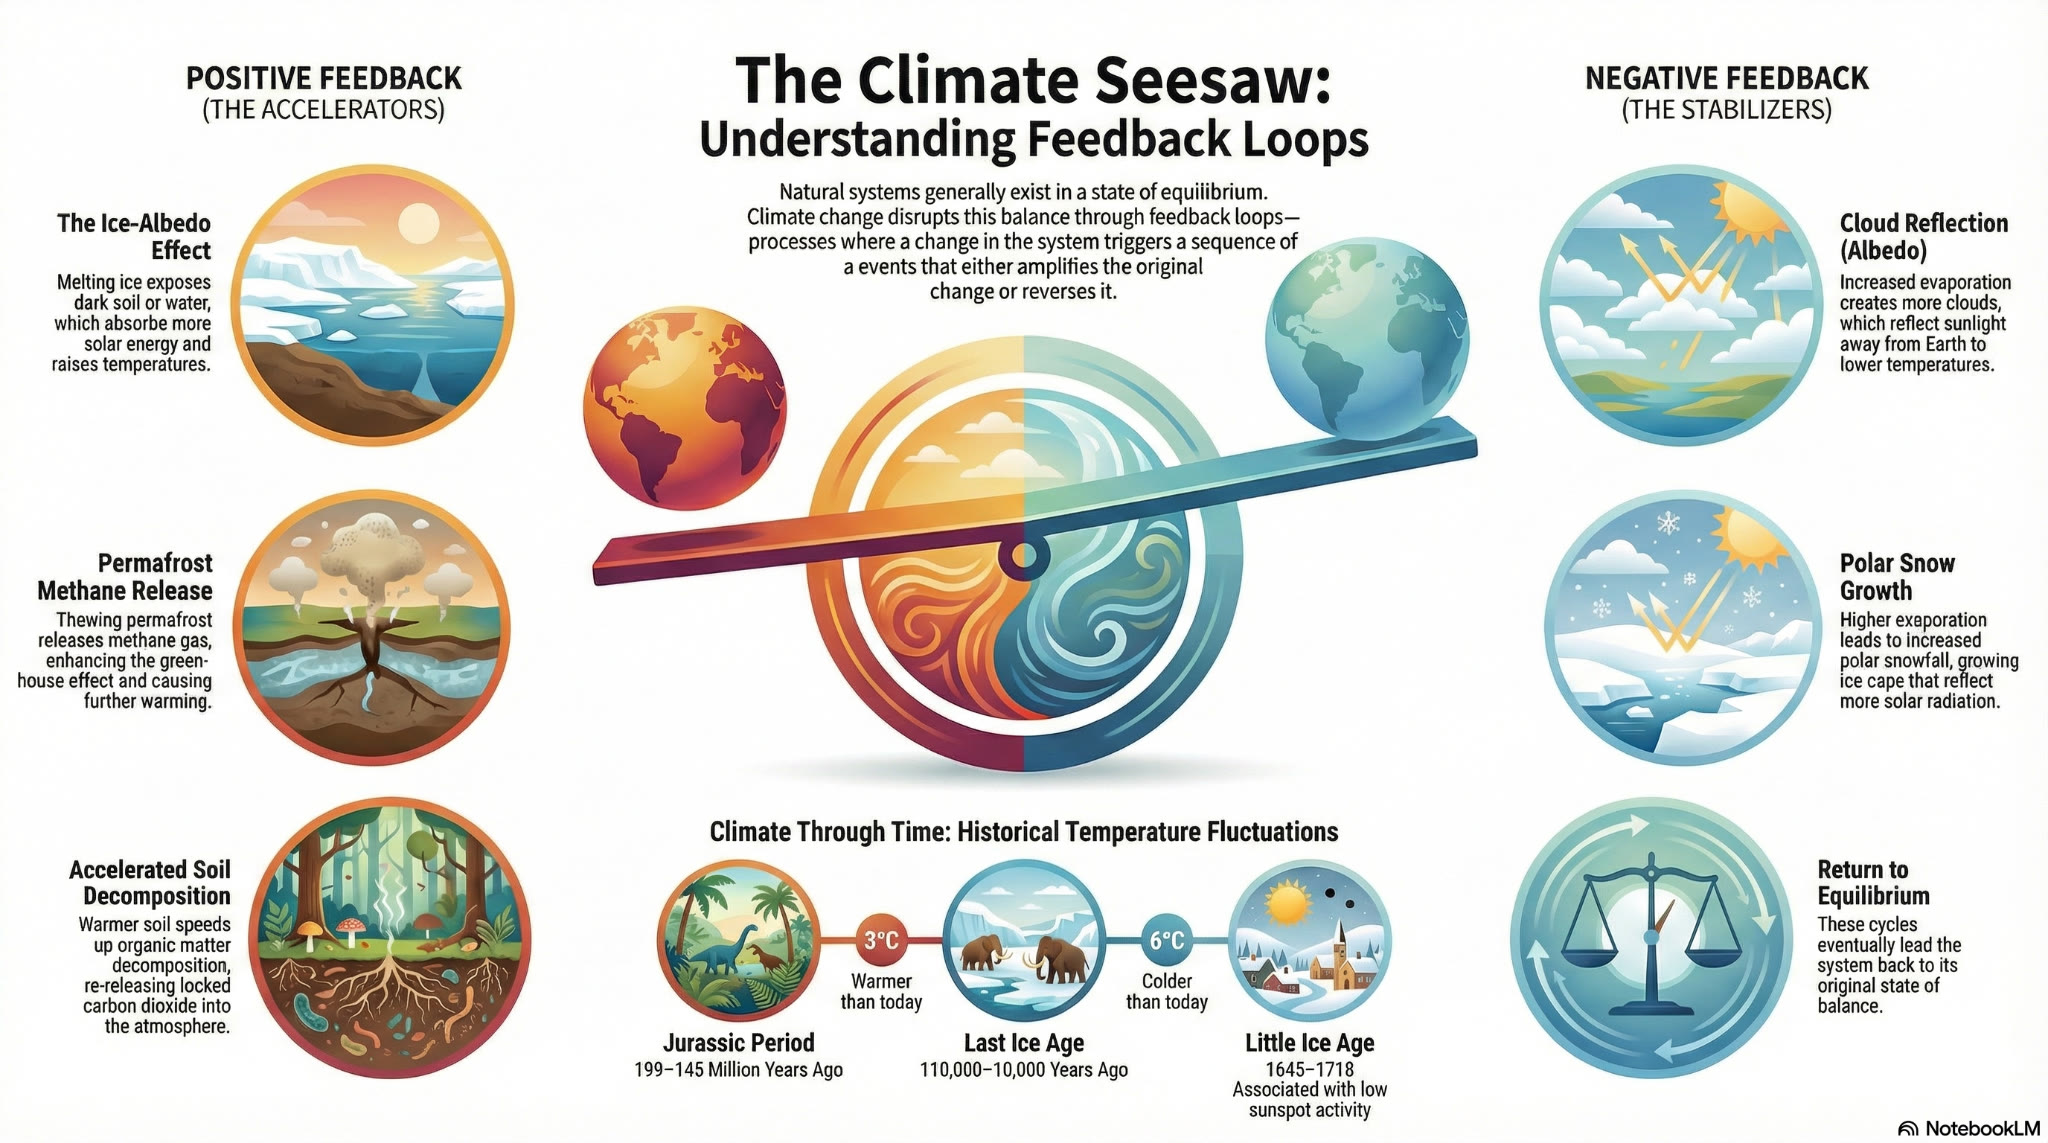
Treat the global energy balance as a set of interacting flows rather than a static diagram. A forcing initiates change; a feedback then amplifies or reduces the original change.
- A positive feedback amplifies an initial change; a negative feedback reduces it and promotes stability.
- Radiative forcing can be positive (warming) or negative (cooling). Its effect depends on magnitude, duration and interaction with other parts of the system.
- Climate tipping points matter because linked feedbacks can produce non-linear, self-reinforcing change.
- Ocean warming is an energy-balance issue: the oceans absorb most excess heat and influence the pace and pattern of atmospheric change.
From forcing to feedback: test the climate seesaw
- Study the new Climate Seesaw visual, then define forcing, positive feedback, negative feedback and tipping point in your own words.
- Classify each example in the visual. For each one, state the initial change, the secondary process and whether it amplifies or reduces the original change.
- Fact-check two claims in the visual using a reliable scientific source. In particular, distinguish the Little Ice Age from the narrower Maunder Minimum dates.
- Construct one causal loop diagram in which every arrow is labelled with increases or decreases.
- Use one linked article to identify the initial forcing, feedback mechanism, geographical scale and possible threshold.
- Decide whether the evidence supports gradual change or the possibility of abrupt change. Justify your judgement.
Watch: Climate feedback loops
Watch: How feedback loops shape natural systems
Solar Radiation Variations & Global Dimming
Changes in the global energy balance resulting from solar radiation variations, including global dimming due to volcanic eruptions.
Separate changes in solar output from changes in how much sunlight reaches Earth's surface. Large explosive eruptions can inject reflective aerosols into the upper atmosphere and temporarily reduce incoming solar energy.
- Solar output varies naturally, but recent rapid warming cannot be explained by solar variation alone.
- Explosive eruptions can create short-term negative forcing by increasing atmospheric aerosols and reflection.
- Global dimming describes reduced solar radiation reaching the surface; it can mask some greenhouse warming without removing its cause.
- Timescale matters: volcanic aerosols are short-lived compared with long-lived carbon dioxide.
Explain a temporary cooling event
- Use the infographic to trace the chain from eruption to aerosol loading, reflection and surface cooling.
- Sketch a temperature graph showing the likely short-term effect of a major eruption and the longer-term greenhouse trend.
- Explain why a volcanic cooling episode does not disprove anthropogenic climate change.

Watch: Volcanic eruptions and global dimming
Terrestrial Albedo Change & Feedback
Changes in the global energy balance resulting from terrestrial albedo changes and feedback loops.
Albedo links the cryosphere, atmosphere and oceans. Bright snow and ice reflect solar energy; darker land and water absorb more. Melting can therefore reinforce the warming that caused it.
- Albedo is the proportion of incoming radiation reflected by a surface.
- Snow and ice have high albedo; open water, forest and bare ground generally have lower albedo.
- Warming reduces snow and ice, exposing darker surfaces that absorb more energy and cause further warming.
- The strength of the feedback varies by season and place, so students should locate it geographically rather than describe it only in the abstract.
Draw the ice–albedo loop
- Study the original melting-feedback infographic and identify each store and transfer.
- Redraw the loop using no more than six boxes and label every link.
- Add one geographical example and explain why the feedback is especially important there.
- Finish with a two-sentence answer distinguishing cause, process and consequence.

Watch: Albedo and climate feedback
Watch: What is the Ice–Albedo Feedback?
Methane Release & Feedback
Changes in the global energy balance resulting from methane gas release and feedback loops.
Methane connects agriculture, wetlands, fossil-fuel systems, permafrost and ocean sediments. It is shorter-lived than carbon dioxide but powerful, and warming can unlock additional natural methane sources.
- Human methane sources include livestock, rice cultivation, landfill and leakage from fossil-fuel extraction and transport.
- Natural stores include wetlands, permafrost and methane hydrates; warming can increase release from some of these stores.
- Permafrost thaw creates a positive feedback: warming promotes decomposition and gas release, which strengthens warming.
- Methane's climate significance depends on both its warming potency and its atmospheric lifetime.
Map methane sources and feedbacks
- Classify the sources in the original global methane infographic as biogenic, fossil-fuel related or waste related.
- Use the three videos to distinguish a human emission source from a climate feedback.
- Annotate a world map with at least four methane source regions or environments.
- Write an exam paragraph explaining why methane is both a development issue and an Earth-systems issue.


Watch: Livestock and methane emissions
Watch: Exploding methane bubbles — BBC Earth
Watch: Methane's role in climate change
The Enhanced Greenhouse Effect
The enhanced greenhouse effect and international variations in greenhouse gas sources and emissions, in relation to economic development, globalization and trade.
Move from physical process to geographical inequality. Students compare total, per-capita and consumption-based emissions, then connect national patterns to development, trade, corporate production networks and individual consumption.
- Human activity increases greenhouse-gas concentrations, strengthening the natural greenhouse effect and creating a positive radiative forcing.
- Total emissions, emissions per person, emissions per unit of GDP and consumption-based emissions answer different questions.
- Economic development changes energy demand and the sectoral mix of emissions; globalization can separate the place of consumption from the place of production.
- Trade can transfer embodied carbon across borders, so territorial accounts alone may hide part of a society's carbon footprint.
- Large fossil-fuel producers and corporations shape emissions, but responsibility also involves governments, consumers, investors and historical development pathways.
Explain the enhanced effect, then audit the evidence
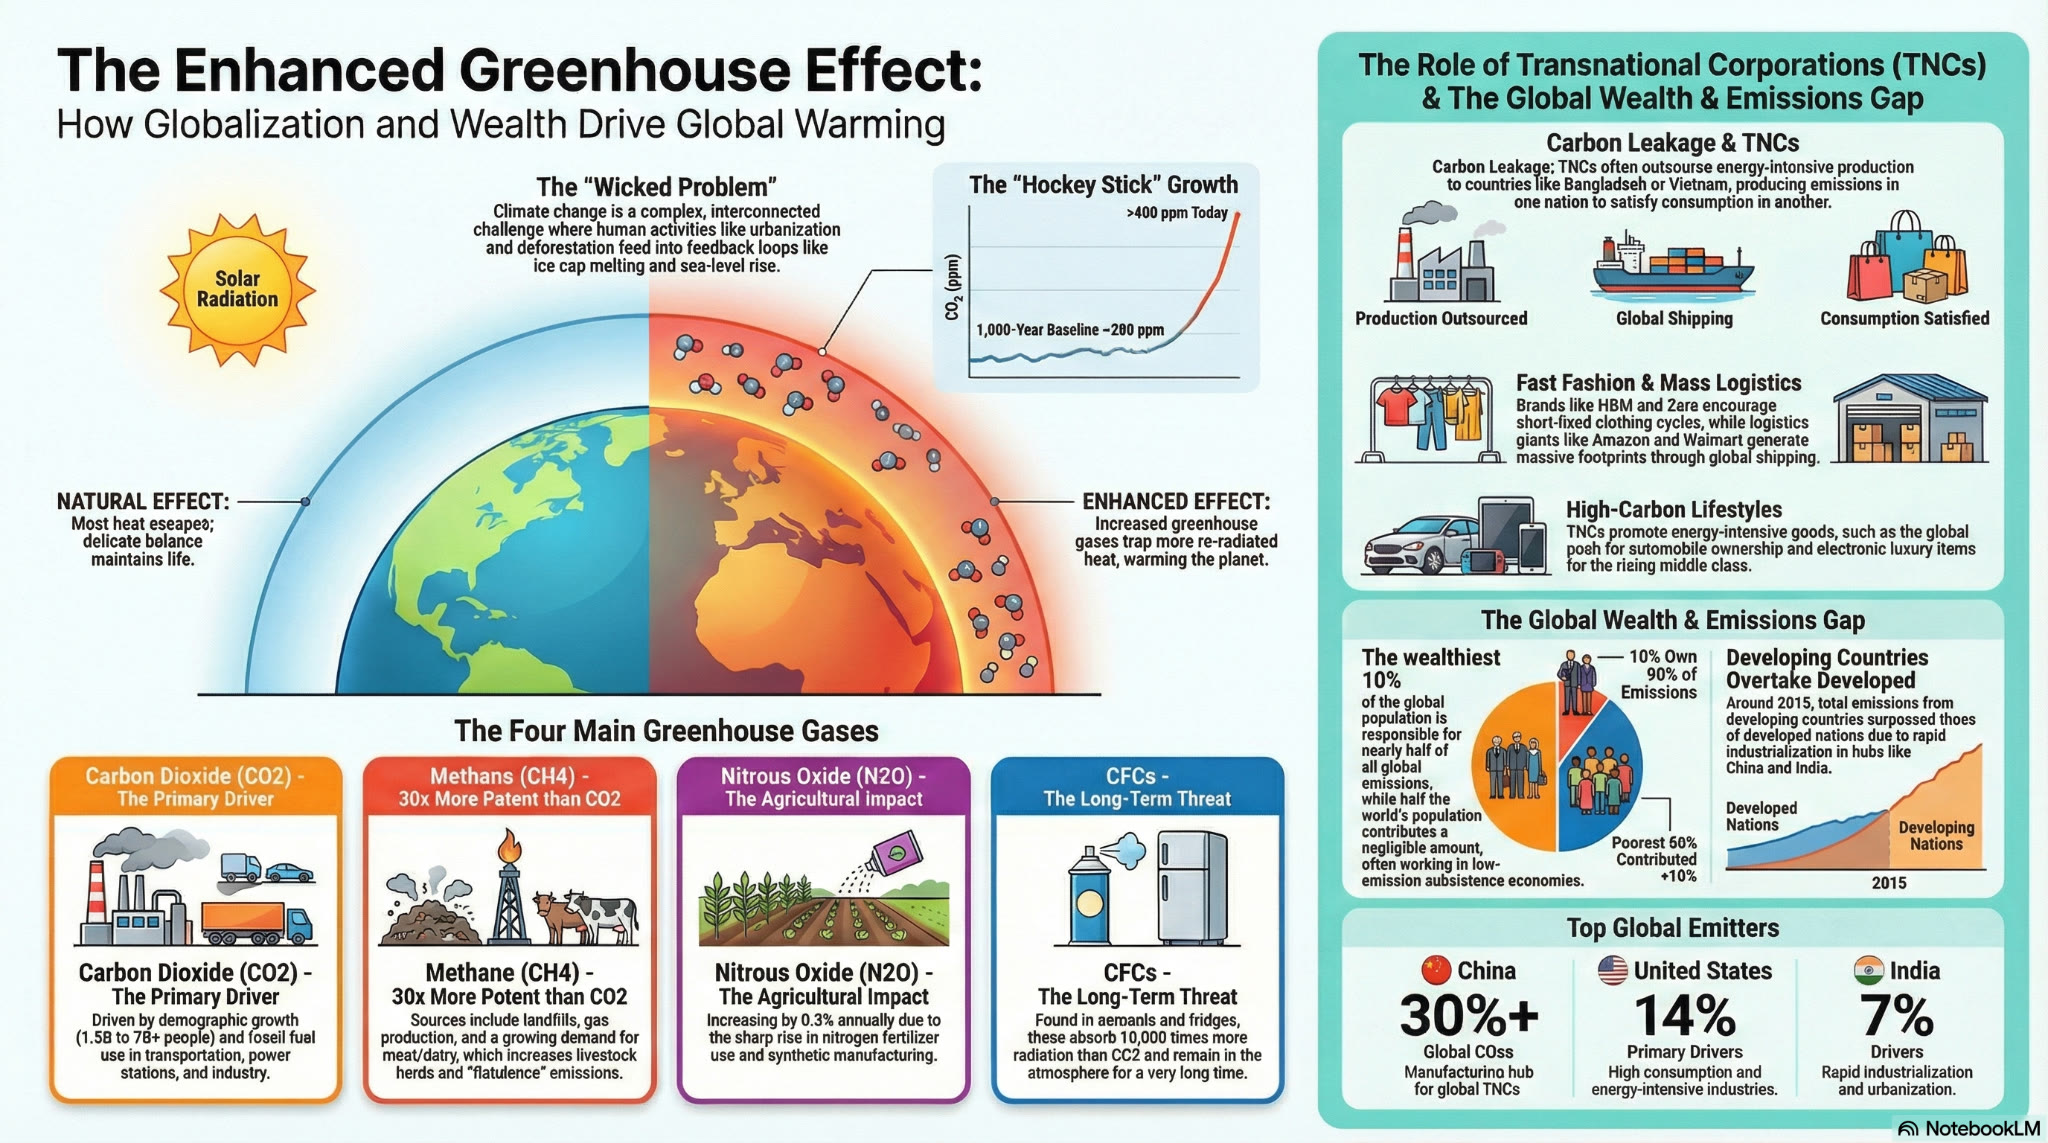
- Use the new infographic to explain the difference between the natural and enhanced greenhouse effects, then identify the four human systems it connects to warming.
- Trace one product from consumption through global shipping to outsourced production and explain how territorial and consumption-based emissions would record it differently.
- Audit three numerical claims in the infographic against the live charts or another authoritative source. Record the source, year and any correction or qualification required.
- Use all four live charts. For each, write the question it answers and one limitation.
- Select two contrasting countries and compare their per-capita emissions, income and sectoral sources.
- Use the Carbon Map video and visual tour to explain how trade can move responsibility between producers and consumers.
- Evaluate the claim that globalization worsens climate change. Include one supporting argument, one counterargument and a reasoned conclusion.


Watch: The Truth About Climate Change — David Attenborough
Watch: Carbon Map introduction
Watch: A visual tour of the world's CO₂ emissions
Watch: Causes and Effects of Climate Change — National Geographic
Watch: How Do Greenhouse Gases Actually Work?
Watch: Students explain climate change
Quizlet: Global energy balance terminology