IB Geography • Section 4
Future Resilience and Adaptation
Future possibilities for lessening human vulnerability to geophysical hazards
Restored from the original AdornGeo Weebly page • syllabus order preserved
Global Hazard Trends and Future Projections
Global geophysical hazard and disaster trends and future projections, including event frequency and population growth estimates.
A hazard becomes a disaster where a damaging physical event overlaps with exposed and vulnerable people. Recorded disasters have increased as populations, cities and reporting networks have grown, but this does not mean that tectonic processes themselves are becoming steadily more frequent.
- Separate the frequency and magnitude of physical events from the number of people exposed and the number of disasters recorded.
- Population growth and rapid urbanisation place more people and infrastructure in fault zones, on unstable slopes and near volcanoes and tsunami-prone coasts.
- Future losses are shaped by governance, inequality, building quality, preparedness and access to technology—not population growth alone.
- Use evidence cautiously: changes in monitoring and reporting can create an apparent trend in smaller recorded events.
Interrogate the trend
- Use the live Our World in Data chart to compare earthquakes, volcanic activity and mass movements over time.
- Describe two trends using dates and figures, then identify one limitation of the data.
- Explain why disaster losses may rise even if the frequency of large earthquakes does not.
- Construct a systems diagram linking population growth, urbanisation, exposure, vulnerability and disaster loss.
Future-risk briefing
- Choose one rapidly growing city exposed to a geophysical hazard.
- Locate it, identify the hazard and explain which groups and infrastructure are most exposed.
- Give a balanced projection: one reason future risk could increase and one reason vulnerability could fall.
Geophysical Hazard Adaptation
Geophysical hazard adaptation through increased government planning (land use zoning) and personal resilience (increased preparedness, use of insurance and adoption of new technology).
Adaptation changes how people use, organise and protect hazardous places. Government planning can alter exposure at city or regional scale; households and communities can strengthen personal resilience before and after an event.
- Land-use zoning uses hazard maps to restrict housing and critical infrastructure in the highest-risk areas.
- Preparedness includes drills, evacuation plans, emergency kits, education and trusted warning systems.
- Insurance transfers some financial risk and can speed recovery, but affordability and exclusions create uneven protection.
- Sensors, satellite imagery, GPS, mobile alerts, resilient construction and community mapping can reduce vulnerability when access and trust are strong.
- Japan's post-2011 relocation illustrates how zoning, raised infrastructure, coastal buffers and evacuation systems can work together.
Adaptation expert groups
- Investigate one strategy: earthquake warning, volcano monitoring, zoning, preparedness, insurance or new technology.
- Explain how it reduces exposure or vulnerability, and who is responsible for it.
- Add one named example, then evaluate cost, reliability, accessibility and possible unintended consequences.
- Present your judgement on the recovered collaborative slideshow and compare it with another strategy.
Government or individual responsibility?
- Create a continuum from mainly government-led to mainly individual-led adaptation.
- Place zoning, building codes, drills, insurance, warning apps and household kits on it.
- Write a justified conclusion explaining why the most resilient system needs action at more than one scale.
Watch: How Japan uses space technology in natural disasters
Watch: Japan's 400-kilometre tsunami shield
Pre-event Management Strategies
Pre-event management strategies for mass movement (to include slope stabilization), earthquakes and tsunami (to include building design, tsunami defences), volcanoes (to include GPS crater monitoring and lava diversions).
Pre-event management cannot remove the tectonic process. It aims to reduce the probability that a hazardous event becomes a disaster through protection, prediction, preparation and carefully designed places.
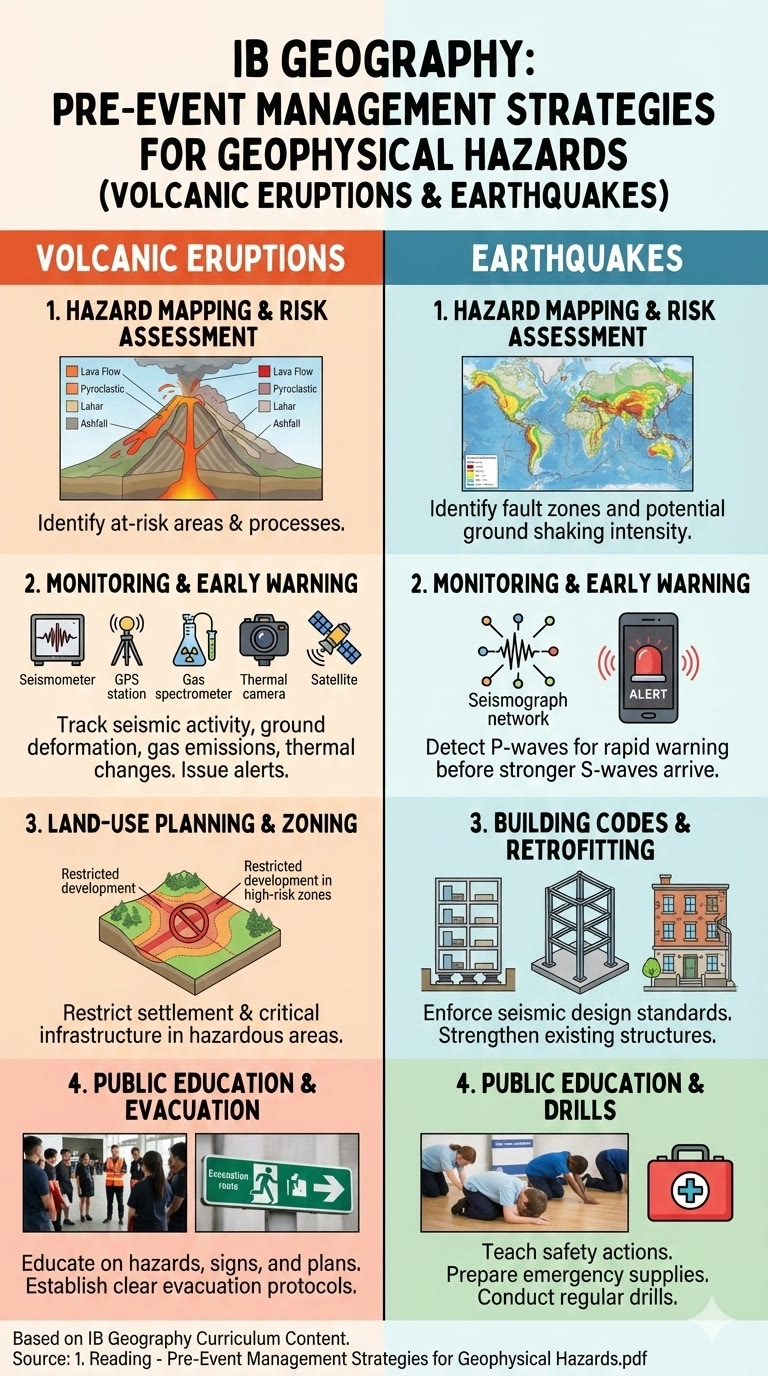
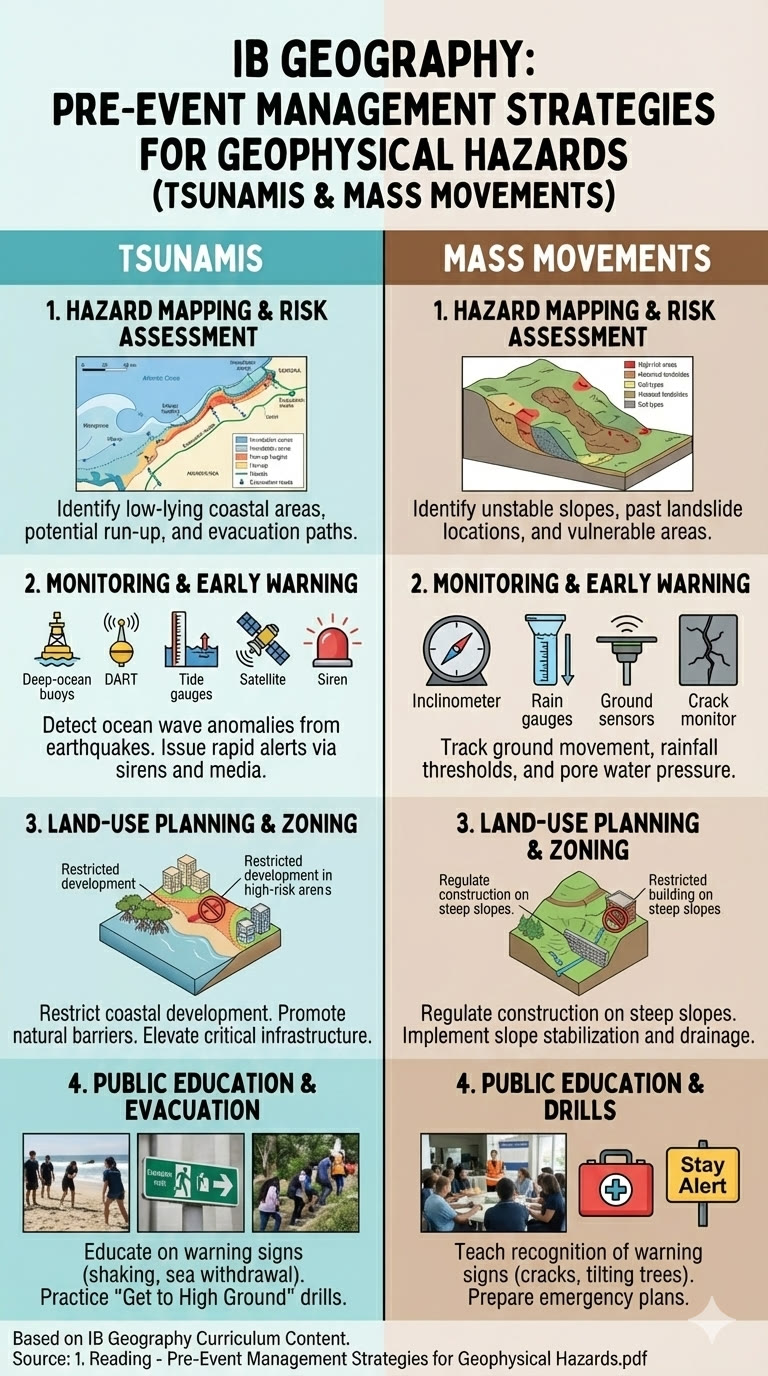
- Mass movement: drainage, retaining walls, rock bolts, netting, vegetation, regrading and land-use controls stabilise slopes in different ways.
- Earthquakes: cross-bracing, shear walls, base isolation, flexible services and enforced building codes reduce collapse and secondary hazards.
- Tsunami: sea walls and coastal forests may reduce energy, while warnings, signed routes, vertical shelters and drills reduce loss of life.
- Volcanoes: GPS, tiltmeters, seismicity and gas measurements track unrest; barriers, channels, cooling and bombing have occasionally diverted lava.
- Every strategy has a design threshold. Evaluate whether it protects everyone, changes behaviour or creates a false sense of security.
Read, classify and challenge the strategies
- Read the embedded pre-event management text, then use the two visual summaries to classify each strategy as monitoring, engineering, land-use planning or preparedness.
- For each of the four hazards, explain the physical process that one strategy is designed to interrupt or respond to.
- Identify one strategy that mainly reduces exposure and one that mainly reduces vulnerability. Justify both choices.
- Challenge the visuals: add one cost, access, maintenance or false-security limitation that is not shown for each hazard.
Design a multi-hazard protection plan
- Build a four-column matrix for mass movement, earthquake, tsunami and volcano management.
- For each hazard, add one monitoring method, one engineering method and one preparedness action.
- Explain the physical process each method interrupts or responds to.
- Rank the strategies by likely effectiveness in a high-income and a lower-income setting, then defend your ranking.
Evaluate a defence
- Use the earthquake-resistant structure and tsunami-wall videos as evidence.
- Identify the design principle, intended users, cost or maintenance issue and likely failure point.
- Write an IB-style paragraph answering: To what extent can engineering reduce geophysical hazard risk?
Watch: How earthquake-resistant structures work
Watch: Japan's tsunami walls — protection and limits
Watch: Large-scale protective engineering in Tokyo
Post-event Management Strategies
Post-event management strategies (rescue, rehabilitation, reconstruction), to include the enhanced use of communications technologies to map hazards/disasters, locate survivors and promote continuing human development.
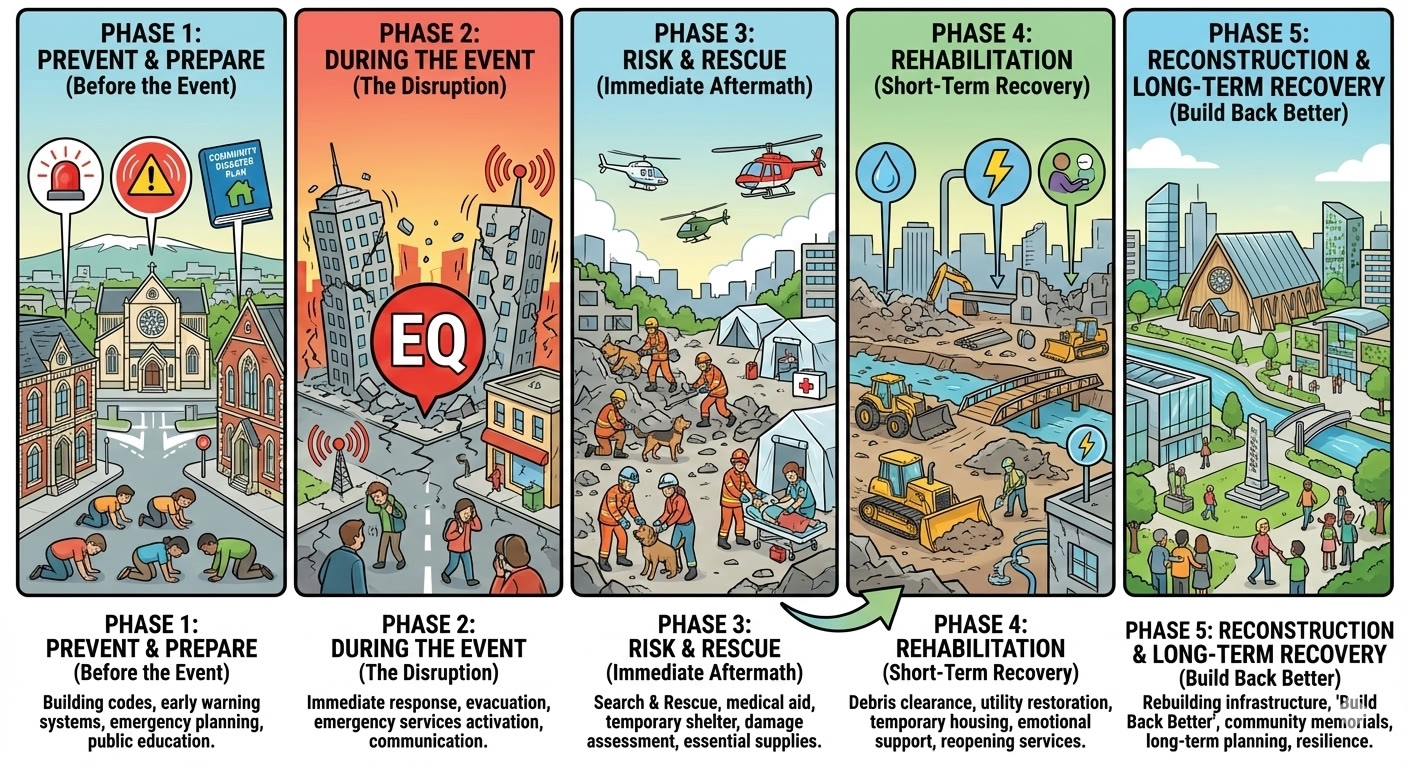
Post-event management moves from life-saving rescue and restoration of essential services to rehabilitation and reconstruction. The strongest recovery does not simply reproduce pre-disaster vulnerability: it builds back safer while protecting livelihoods and continuing human development.
- Rescue: locate survivors, provide triage, water, shelter, sanitation and restore access and communications.
- Rehabilitation: reopen services, support displaced people, restore livelihoods and reduce disease and secondary risks.
- Reconstruction: rebuild homes, infrastructure and institutions to safer standards, often over many years.
- GIS, satellite imagery, drones, GPS, SMS, social media and crowdsourced maps turn scattered observations into decisions about needs and access.
- Communication systems must be interoperable, trusted, accessible and usable when power and networks fail.
Christchurch: follow recovery through five stages
- Study the Christchurch five-stage graphic and build a timeline from prevention and preparedness to long-term reconstruction.
- For each stage, identify the dominant goal, two likely stakeholders and one form of technology or communication that supports action.
- Explain why rehabilitation and reconstruction overlap rather than occurring as completely separate phases.
- Evaluate whether Christchurch's long-term recovery demonstrates 'build back better' socially as well as physically. Identify evidence you would need to reach a secure judgement.
Haiti response timeline
- Read the embedded post-event management text and Haiti reconstruction case study.
- Sort the response cards into rescue/restore, rehabilitation, reconstruction I and reconstruction II.
- Add a time scale and responsible stakeholder to each response.
- Evaluate which responses reduced vulnerability and which risked reproducing it.
ICT disaster-response briefing
- Choose early warning, GIS mapping, SMS/social media, drones, crowdsourcing, satellite imagery or search-and-rescue robots.
- Explain the system and show how it reduces vulnerability in the short, medium and long term.
- Use one real event to identify when, where and how it was used.
- Evaluate one access, accuracy, privacy, infrastructure or coordination limitation.
Exam synthesis
- Compare one pre-event and one post-event strategy for a named geophysical hazard.
- Judge effectiveness using lives protected, speed, cost, equality, sustainability and capacity to support development.
- Finish with a reasoned answer to: Which matters more—technology or governance?
Watch: In disaster relief, information is life and death
Watch: Space technology in Japanese disaster response
Watch: ICTs and disaster management